Kairi Relative Index (KRI): Definition & Technical Analysis
The Kairi Relative Index (KRI) is a type of oscillator indicator. It measures the deviation of an asset price from its daily average over a certain period of time, usually 10 to 20 days. The index was originally developed in Japan and now serves as a tool for technical analysisTechnical Analysis - A Beginner's GuideTechnical analysis is a form of investment valuation that analyses past prices to predict future price action. Technical analysts believe that the collective actions of all the participants in the market accurately reflect all relevant information, and therefore, continually assign a fair market value to securities..
Traders can time their transactions based on the KRI. However, the KRI is less commonly used nowadays, as other oscillators, such as the Relative Strength Index (RSI)Relative Strength Index (RSI)The Relative Strength Index (RSI) is one of the most popular and widely used momentum oscillators. It was originally developed by the famed mechanical engineer turned technical analyst, J. Welles Wilder. The RSI measures both the speed and rate of change in price, are gaining more popularity.
Summary
- The Kairi Relative Index (KRI) is a momentum oscillator indicator that measures the change of an asset price during a specific time period. The index compares the current price with its moving average over the look-back period.
- The KRI swings up and down around zero. A value far above zero indicates overbought and gives a selling signal, while a value far below zero indicates oversold and gives a buying signal.
- Other types of momentum oscillators include the Relative Strength Index (RSI), stochastic oscillator, etc.
Understanding the Kairi Relative Index
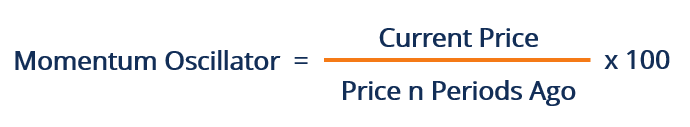
The Kairi Relative Index (KRI) is a momentum oscillator indicator that supports technical analysis by monitoring the rate of price change. A momentum oscillator measures the change of an asset price during a specific time period. It is usually calculated by dividing the current price by the price of a previous period. Based on the formula, the calculation of different oscillator indicators varies to serve different purposes better.
Typically, the result is multiplied by 100, which gives a threshold of 100. A value below 100 indicates a negative momentum with decreasing price, and a value above 100 indicates a positive momentum with increasing price over the chosen time period.
No upper or lower boundaries exist for a momentum oscillator, but a high or low value supports an assumption that the trend will continue and thus gives a buy or sell signal. However, if the price increase or decrease is not confirmed by its momentum oscillator, a mean-reversal movement is signaled.
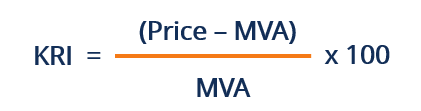
The KRI is one of the many types of momentum oscillators. It compares the current price with the moving averageMoving AverageA moving average is a technical indicator that market analysts and investors may use to determine the direction of a trend. It sums up the data points of the price during the current chosen period is calculated as follows:
Where:
- Price – Current price
- MVA – Simple moving average of price over the current period
Due to a different method of calculation. The KRI can be either a positive or a negative number. When the current price is higher than the MVA, the KRI is positive; when the current price is lower than the MVA, the KRI is negative.
For example, if the price of a security is currently $50 and the current 10-day MVA is $60, the KRI will be -16.7 [($50–$60) / $60*100]. If the price increases to $90 two weeks later, and the 10-day MVA also increases to $70, the KRI will be 28.6 [($90–$70) / $70*100].
Let’s assume a value of 28.6 is a high point for the KRI of the asset. It means the asset might be overbought, and a movement of mean-reversal might occur soon.
The Use of the Kari Relative Index
The KRI, as a tool for technical analysis, facilitates traders to make buy and sell decisions. The KRI is presented as a line moving up and down around zero. An upward sloping KRI line indicates an upward momentum of price, while a downward sloping KRI line indicates a downward momentum of price. The momentum is strong when the line is far away from zero.
When the KRI is significantly high above zero, the asset is probably overbought (overvalued). This can be a selling signal to traders, expecting for mean-reversal or corrective pullback. A KRI significantly down below zero is a signal of oversold (undervalued), and traders typically make buy decisions based on the information.
Other Oscillators
The Relative Strength Index (RSI) is another type of momentum oscillator, which is now used more often than the KRI. It measures the speed of price movements. Unlike the KRI, which compares the current asset price and the moving average, the RSI compares the previous average gain and loss with the current gain and loss.
The RSI moves between 0 and 100 with a threshold at 70. Typically, an RSI above 70 indicates the asset may be oversold (overvalued), while a value below 30 indicates the asset is oversold (undervalued) and gives a selling signal.
A stochastic oscillator compares the most recent closing price with the difference between the high and low of a previous period. The mean-reversal level of a stochastic oscillator depends on the price moving range over the look-back period, which is 14 days typically.
The use of a stochastic oscillator is based on the assumption that the most recent closing price should settle along with the current trend. Thus, it works most effectively within a consistent trading range, for example, in a choppy market.
Additional Resources
CFI is the official provider of the global Capital Markets & Securities Analyst (CMSA)®Program Page - CMSAEnroll in CFI's CMSA® program and become a certified Capital Markets &Securities Analyst. Advance your career with our certification programs and courses. certification program, designed to help anyone become a world-class financial analyst. To keep advancing your career, the additional CFI resources below will be useful:
- Advanced Technical AnalysisAdvanced Technical AnalysisAdvanced technical analysis usually involves using either multiple technical indicators or a rather sophisticated (i.e., complex) indicator. "Sophisticated"
- Momentum IndicatorsMomentum IndicatorsMomentum indicators are tools utilized by traders to get a better understanding of the speed or rate at which the price of a security changes. Momentum
- MACD OscillatorMACD Oscillator - Technical AnalysisThe MACD Oscillator is used to examine short-term moving average convergence and divergence. The MACD Oscillator is a double-edged technical indicator in that it offers traders and analysts the ability to follow trends in the market, as well as gauge the momentum of price changes.
- Simple Moving Average (SMA)Simple Moving Average (SMA)Simple Moving Average (SMA) refers to a stock's average closing price over a specified period. The reason the average is called "moving" is that the stock
-

NASDAQ-100 Index: Definition, Components & Historical Data
The NASDAQ-100 Index is a stock market index that includes 100 of the largest, most actively traded, non-financial companies that are listed on the Nasdaq Stock Market. A stock market index helps inve
-
NYSE Composite Index: Definition & What It Measures
The NYSE Composite Index is an index that tracks stocks traded on the New York Stock Exchange. It also measures real estate investment trustsReal Estate Investment Trust (REIT)A real estate investment
invest
- Advance-Decline Line: Understanding Market Sentiment & Trends
- Arms Index (TRIN): Understanding Short-Term Market Sentiment
- EAFE Index: Understanding Developed Market Performance
- Kairi Relative Index (KRI): Definition & Technical Analysis
- Nikkei Index: Understanding Japan's Top Stock Market Indicator
- Price-Weighted Index Explained: How It Works & Examples
- Relative Strength Index (RSI): A Comprehensive Guide
- Understanding the S&P 500: Top Holdings & Long-Term Performance
- Understanding the Consumer Price Index (CPI): A Comprehensive Guide
-
 KBW Bank Index: Tracking US Banking Sector Performance
The KBW Bank Index serves as a benchmark that is used to track the performance of leading banking institutions and publicly-traded assets in the United States. The KBW Index comprises 24 banking equit...
-
 KOSPI: Understanding South Korea's Stock Market Index
The Korean Composite Stock Price Index (KOSPI) is a group of indexes that track the stock exchange in South Korea. It was previously named the Korea Stock Exchange. Just as the NASDAQ Composite Index ...