Relative Strength Index (RSI): A Comprehensive Guide
The Relative Strength Index (RSI) is one of the most popular and widely used momentum oscillators. It was originally developed by the famed mechanical engineer turned technical analyst, J. Welles Wilder. The RSI measures both the speed and rate of change in price movementsMomentum InvestingMomentum investing is an investment strategy aimed at purchasing securities that have been showing an upward price trend or short-selling securities that within the market.
Source
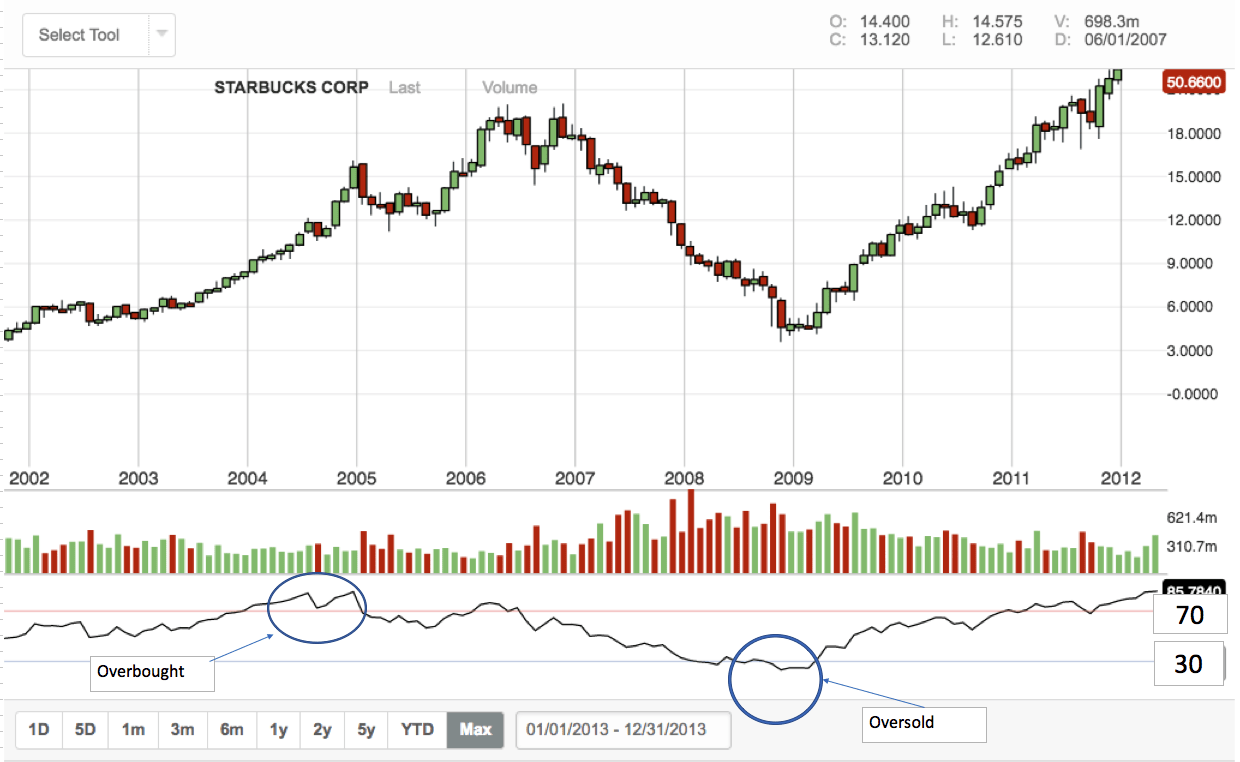
The values of the RSI oscillator, typically measured over a 14-day period, fluctuate between zero and 100. The Relative Strength Index indicates oversold market conditions when below 30 and overbought market conditions when above 70. It is frequently used by swing traders. They look for signals of waning or strengthening momentum in short to intermediate term price movements within a market. Overbought or oversold conditions often immediately precede short-term trend changes that present trading opportunities.
Calculating the RSI
Calculation of the RSI, to be done thoroughly, requires a great deal of highly technical and complex explanations. To fully understand how the calculation is accomplished, traders and analysts should read Wilder’s own explanation. It is presented in his 1978 book, New Concepts in Technical Trading Systems.
However, the index can be broken down into a (fairly) simple formula:
RSI = 100 – [100 / (1 + (Average of Upward Price Change / Average of Downward Price Change)]
The Relative Strength Index – What to Watch Out For
Traditionally, the Relative Strength Index is considered to signal overbought conditions when above 70 and oversold conditions when under 30. The levels can be adjusted, however, to better fit the price movement of a specific securityMarketable SecuritiesMarketable securities are unrestricted short-term financial instruments that are issued either for equity securities or for debt securities of a publicly listed company. The issuing company creates these instruments for the express purpose of raising funds to further finance business activities and expansion. a trader is watching. If, for example, a security’s RSI consistently hits above the 70 mark or below the 30 mark without correctly forecasting a change in price trend, a trader might adjust the upper end to 80 and/or the lower end to 20 to get more reliable trading signals.
Traders should keep in mind that during periods of very strong trends, a security’s price may continue to rise for a long time after an oscillator such as the RSI signals “overbought” conditions in the market. The same caveat applies to extended downtrend price movement that may occur well after an RSI indication of a market being “oversold”.
“Normal” RSI Values and the RSI as a Divergence Indicator
Bullish and bearish marketsBullish and BearishProfessionals in corporate finance regularly refer to markets as being bullish and bearish based on positive or negative price movements. A bear market is typically considered to exist when there has been a price decline of 20% or more from the peak, and a bull market is considered to be a 20% recovery from a market bottom. play a big role in how the RSI behaves. During a bull market, RSI values normally sit in the 40 to 90 range, with the 40-50 range seen as support. In a bear market, the reading typically stays within the 10 to 60 range, with the 50-60 zone signaling resistance. These ranges are typical but may vary based on the settings for the index, as well as the strength of the underlying market trend for any given security.
In addition to the basic 70/80 or 30/20 readings, traders also watch for divergence between price movement and the value of the RSI. When price hits a new low or high that isn’t supported by a corresponding new low or high in the RSI reading, this can indicate an impending price reversal in the market.
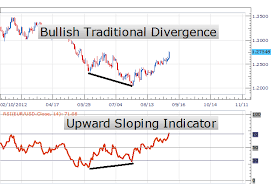
An Example of RSI Divergence
The chart below shows an example of divergence between price and the Relative Strength Index. Near the center of the chart, as marked by a thick black line, the price of the security continues to decline, making a new low just before a market reversal to the upside begins around the end of July. However, the RSI (plotted in the lower chart window) does not follow suit and make a corresponding new low. Instead, it has already begun to turn to the upside near the beginning of June. The RSI is exhibiting a bullish divergence from price. As the chart’s subsequent price action reveals, this bullish divergence correctly forecasted an upcoming trend change, from downtrend to uptrend.
The Relative Strength Index is among the most popular technical indicators, helping traders determine potentially good buy entry points (when a security is oversold) and sell points (when a security is overbought). It is also frequently watched for divergence signals of possible upcoming trend changes.
Related Readings
We hope you’ve enjoyed reading CFI’s guide to the Relative Strength Index. CFI offers the Financial Modeling & Valuation Analyst (FMVA)™Become a Certified Financial Modeling & Valuation Analyst (FMVA)®CFI's Financial Modeling and Valuation Analyst (FMVA)® certification will help you gain the confidence you need in your finance career. Enroll today! certification program for those looking to take their careers to the next level. To keep learning and advancing your career, the following resources will be helpful:
- Aroon IndicatorAroon Indicator - Technical AnalysisThe aroon indicator uses the aroon-up and aroon-down calculations to identify the beginning of a new trend, or a changing trend in the market.
- Long and Short PositionsLong and Short PositionsIn investing, long and short positions represent directional bets by investors that a security will either go up (when long) or down (when short). In the trading of assets, an investor can take two types of positions: long and short. An investor can either buy an asset (going long), or sell it (going short).
- McClellan OscillatorMcClellan Oscillator - Technical AnalysisThe McClellan Oscillator is a type of momentum oscillator. The McClellan Oscillator is calculated using exponential moving averages, and is designed to indicate the strength or weakness of price movement, rather than its direction.
- Short CoveringShort CoveringShort covering, also called "buying to cover", refers to the purchase of securities by an investor to close a short position in the stock market. The process is closely related to short selling. In fact, short covering is part of short selling
-

Heston Model: Understanding Volatility in Financial Options
The Heston model is a stochastic model used to evaluate the volatility of an underlying asset. Like other stochastic models, the Heston model assumes that the volatility of an asset follows a random p
-
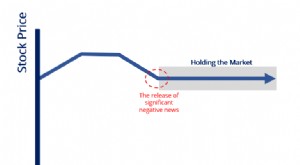
Understanding Market Support: What is 'Holding the Market'?
Holding the market refers to a market participant (or participants) that places or maintains buy orders for a security whose price is expected to fall rapidly – or is in the process of – t
invest
- Relative Strength Index (RSI): A Comprehensive Guide to Trading
- RSI vs. Stochastic Oscillator: A Comparative Analysis
- EAFE Index: Understanding Developed Market Performance
- Kairi Relative Index (KRI): Definition & Technical Analysis
- Nikkei Index: Understanding Japan's Top Stock Market Indicator
- Price-Weighted Index Explained: How It Works & Examples
- Relative Price Strength (RPS): A Technical Analysis Guide
- Understanding the S&P 500: Top Holdings & Long-Term Performance
- Relative Strength Index (RSI): A Comprehensive Guide for Traders
-
 Understanding the Forward Curve: A Comprehensive Guide
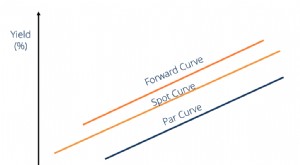
The forward curve or the future curve is the graphicalTypes of GraphsTop 10 types of graphs for data presentation you must use - examples, tips, formatting, how to use them for effective communication...
-
 Understanding the Heath-Jarrow-Morton (HJM) Interest Rate Model
The Heath-Jarrow-Morton Model – also known as the HJM Model – is a framework to represent forward interest rates using an existing term structure of interest rates. The model was created b...