Variance Analysis: Understanding & Improving Performance
Variance analysis can be summarized as an analysis of the difference between planned and actual numbers. The sum of all variances gives a picture of the overall over-performance or under-performance for a particular reporting periodFiscal Year (FY)A fiscal year (FY) is a 12-month or 52-week period of time used by governments and businesses for accounting purposes to formulate annual. For each item, companies assess their favorability by comparing actual costs Fixed and Variable CostsCost is something that can be classified in several ways depending on its nature. One of the most popular methods is classification accordingto standard costs in the industry.
For example, if the actual cost is lower than the standard cost for raw materials, assuming the same volume of materials, it would lead to a favorable price variance (i.e., cost savings). However, if the standard quantity was 10,000 pieces of material and 15,000 pieces were required in production, this would be an unfavorable quantity variance because more materials were used than anticipated.
Learn variance analysis step by step in CFI’s Budgeting and Forecasting course.
The Role of Variance Analysis
When standards are compared to actual performance numbers, the difference is what we call a “variance.” Variances are computed for both the price and quantity of materials, labor, and variable overhead, and are reported to management. However, not all variances are important.
Management should only pay attention to those that are unusual or particularly significant. Often, by analyzing these variances, companies are able to use the information to identify a problem so that it can be fixed or simply to improve overall company performance.
Types of Variances
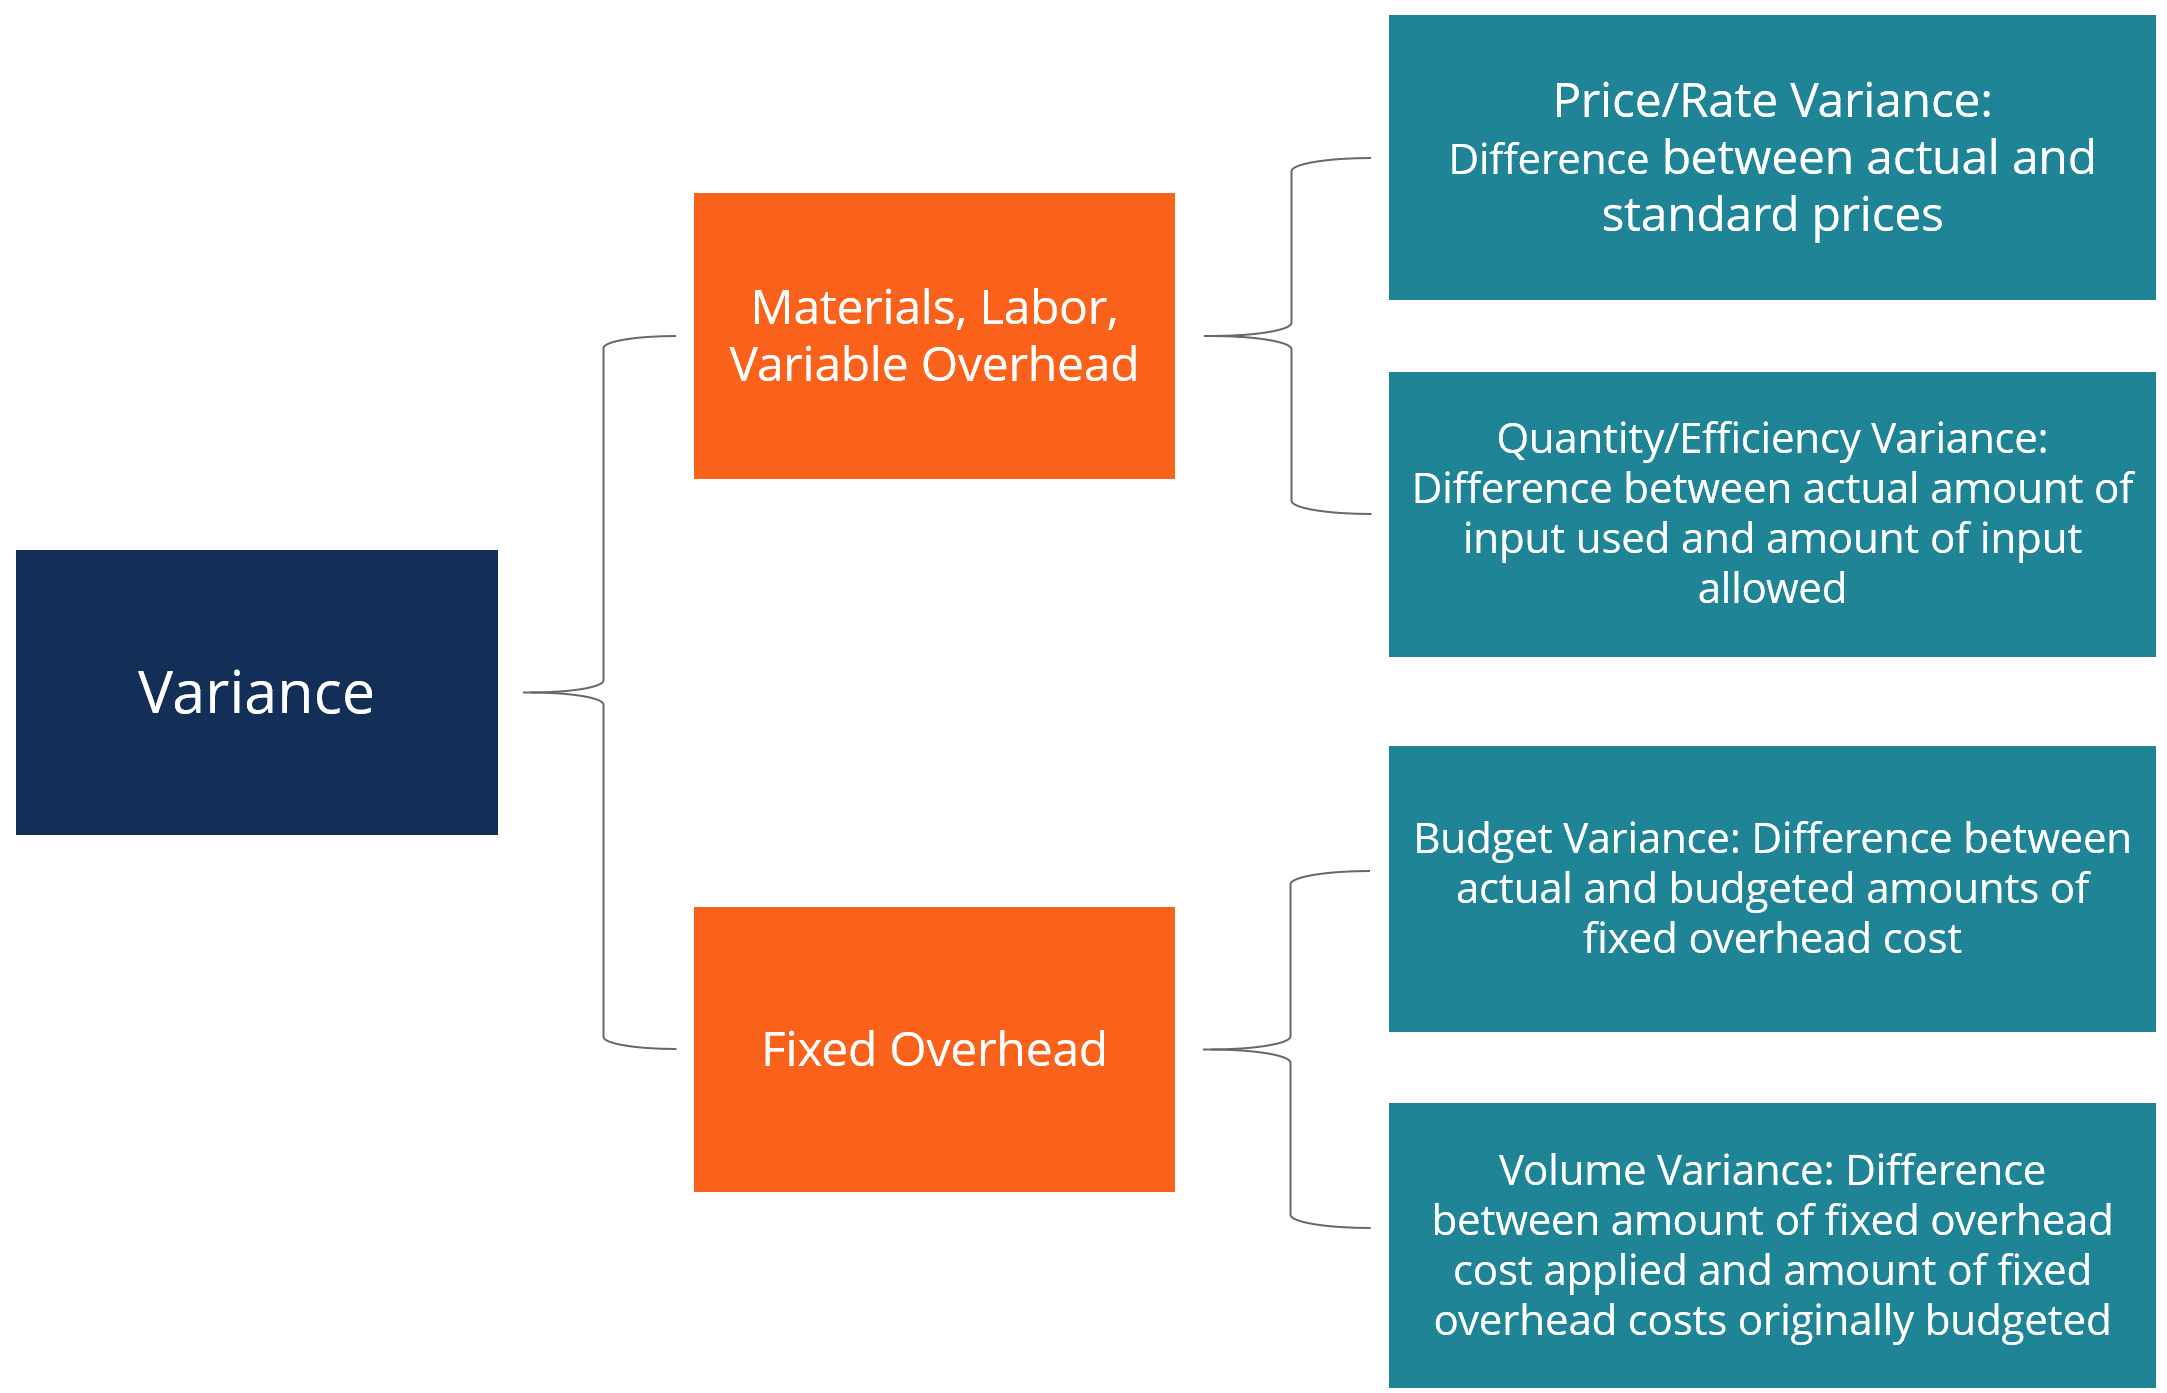
As mentioned above, materials, labor, and variable overhead consist of price and quantity/efficiency variances. Fixed overhead, however, includes a volume variance and a budget variance.
Learn variance analysis step by step in CFI’s Budgeting and Forecasting course.
The Column Method for Variance Analysis
When calculating for variances, the simplest way is to follow the column method and input all the relevant information. This method is best shown through the example below:
XYZ Company produces gadgets. Overhead is applied to products based on direct labor hours. The denominator level of activity is 4,030 hours. The company’s standard cost card is below:
Direct materials: 6 pieces per gadget at $0.50 per piece
Direct labor: 1.3 hours per gadget at $8 per hour
Variable manufacturing overhead: 1.3 hours per gadget at $4 per hour
Fixed manufacturing overhead: 1.3 hours per gadget at $6 per hour
During January, the company produced 3,000 gadgets. The fixed overhead expense budget was $24,180. Actual costs in January were as follows:
Direct materials: 25,000 pieces purchased at the cost of $0.48 per piece
Direct labor: 4,000 hours were worked at the cost of $36,000
Variable manufacturing overhead: Actual cost was $17,000
Fixed manufacturing overhead: Actual cost was $25,000
Materials Variance
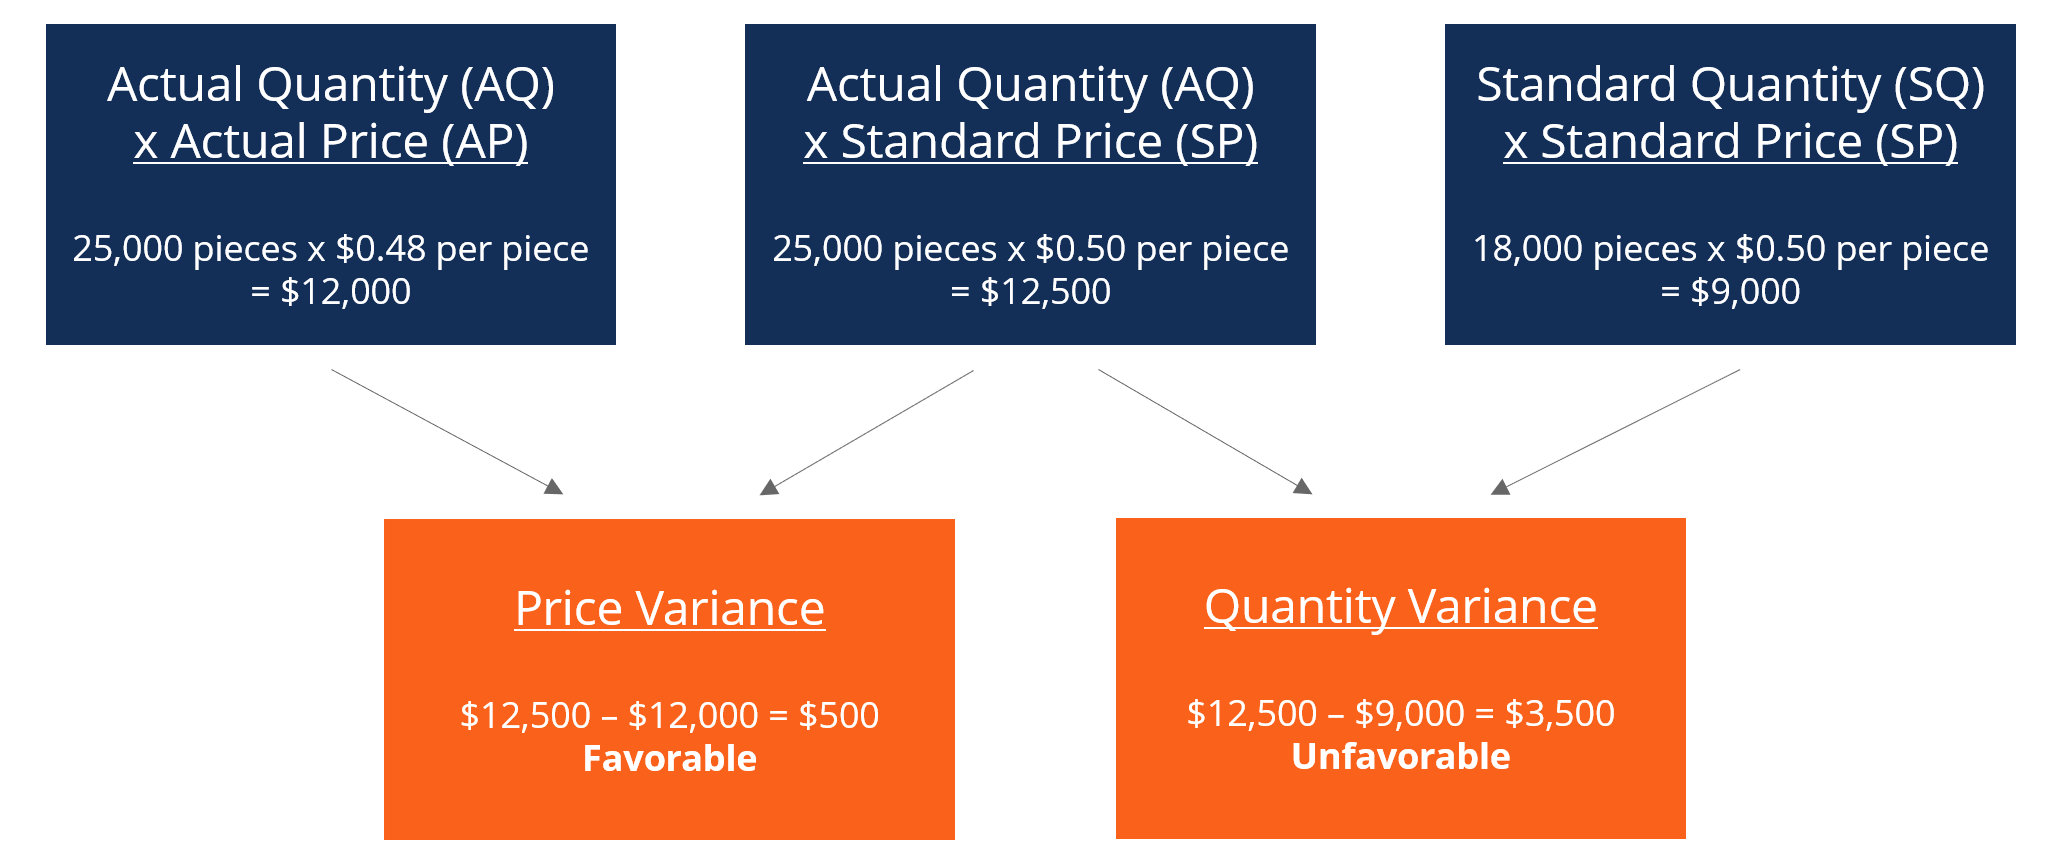
Adding these two variables together, we get an overall variance of $3,000 (unfavorable). It is a variance that management should look at and seek to improve. Although price variance is favorable, management may want to consider why the company needs more materials than the standard of 18,000 pieces. It may be due to the company acquiring defective materials or having problems/malfunctions with machinery.
Labor Variance
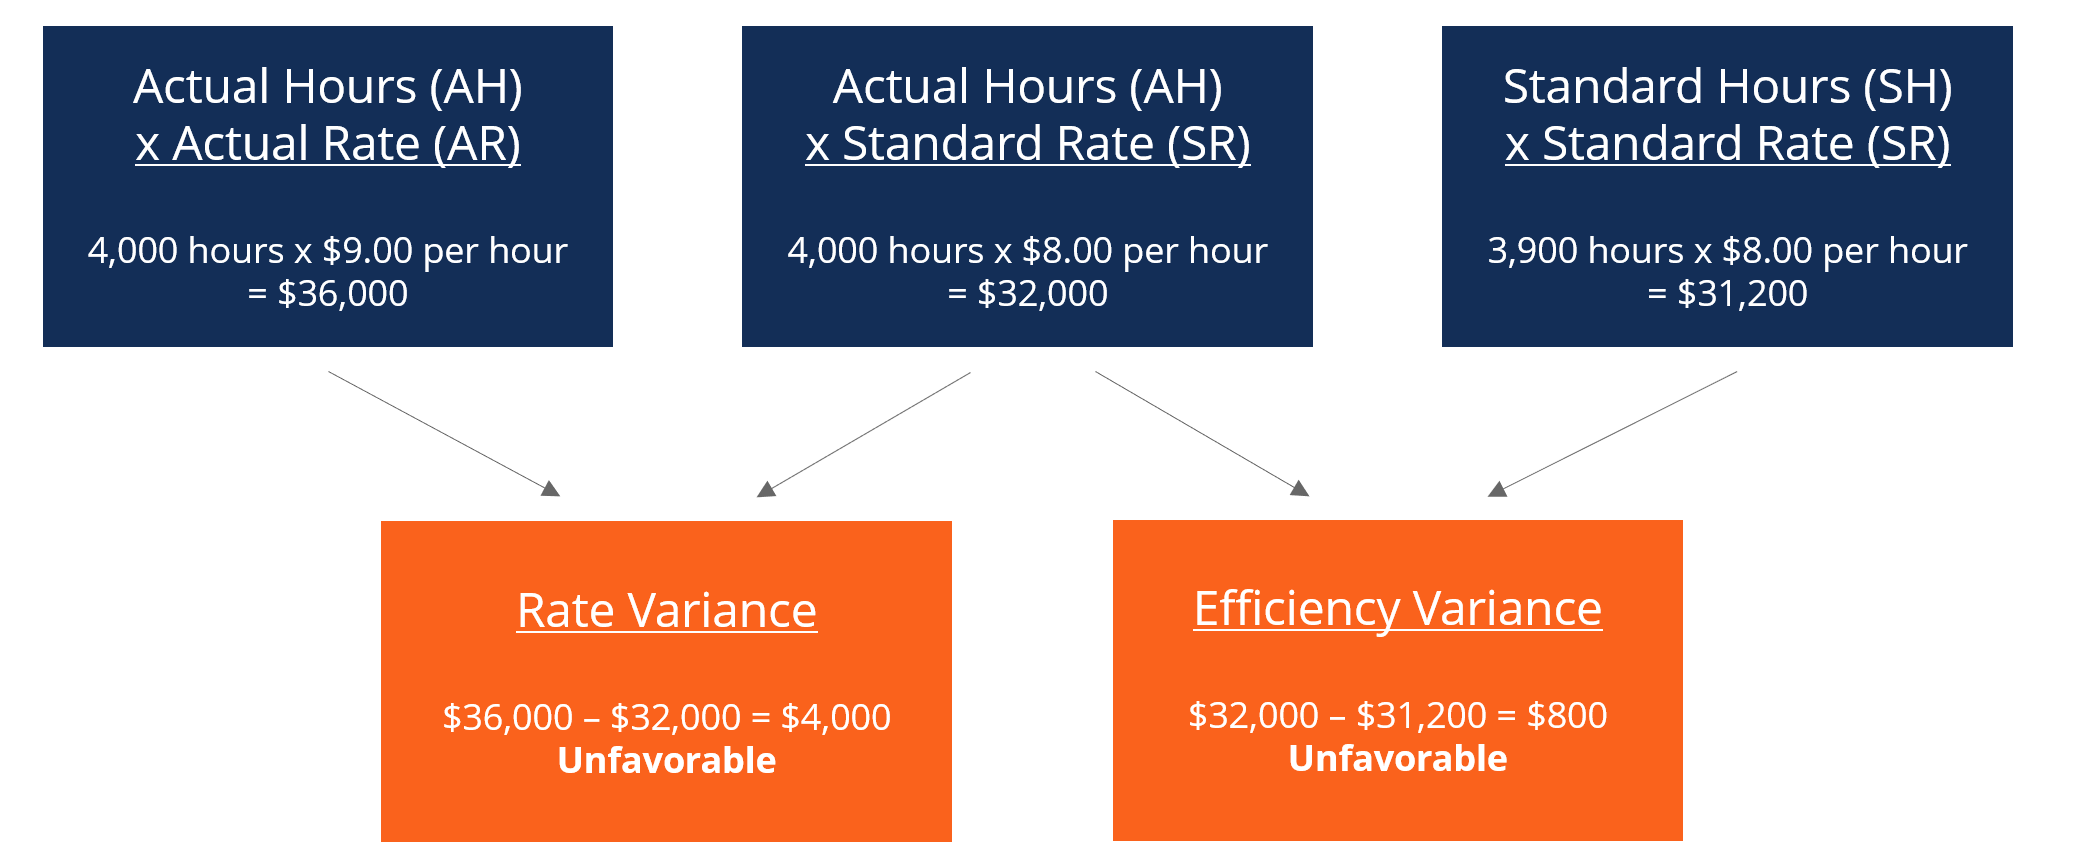
Adding the two variables together, we get an overall variance of $4,800 (Unfavorable). This is another variance that management should look at. Management should address why the actual labor price is a dollar higher than the standard and why 1,000 more hours are required for production. The same column method can also be applied to variable overhead costs. It is similar to the labor format because the variable overhead is applied based on labor hours in this example.
Learn variance analysis step by step in CFI’s Budgeting and Forecasting course.
Fixed Overhead Variance
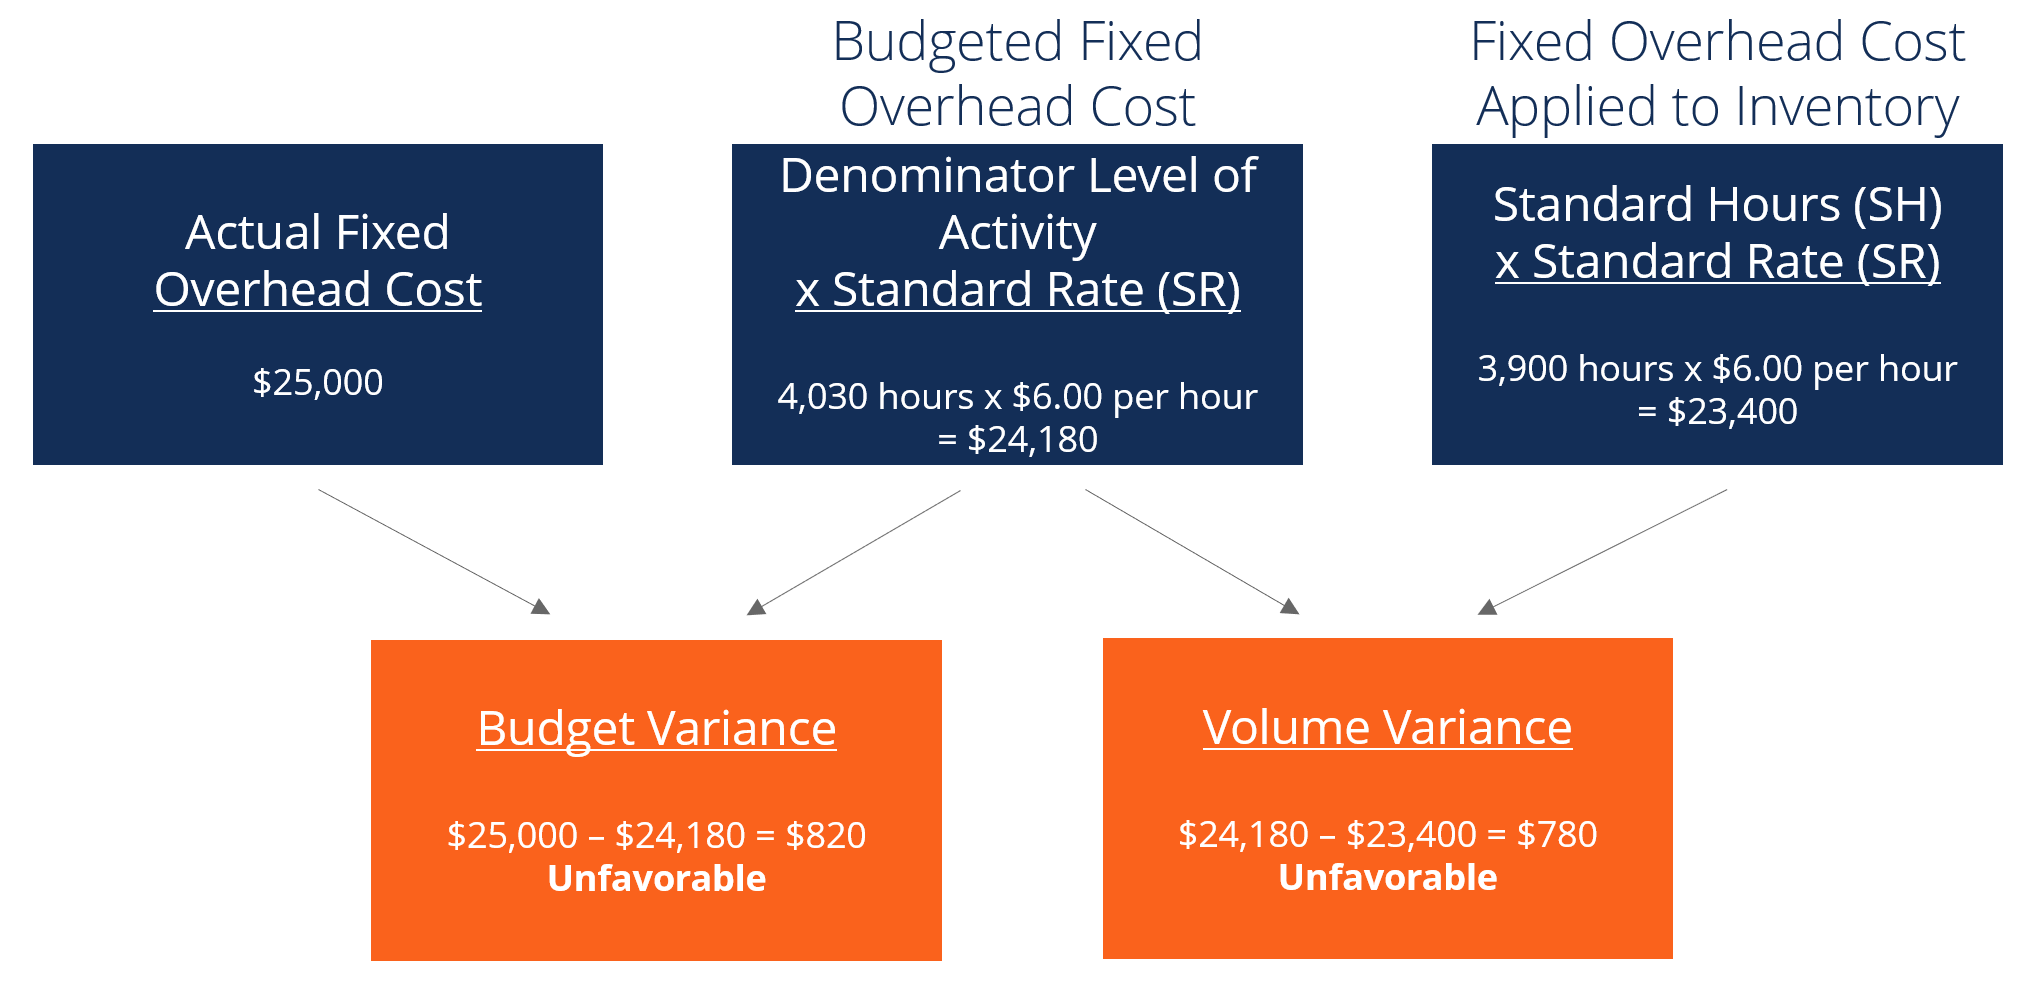
Adding the budget variance and volume variance, we get a total unfavorable variance of $1,600. Once again, this is something that management may want to look at.
Download the Free Template
Enter your name and email in the form below and download the free template (from the top of the article) now!
The Role of Standards in Variance Analysis
In cost accounting, a standard is a benchmark or a “norm” used in measuring performance. In many organizations, standards are set for both the cost and quantity of materials, labor, and overhead needed to produce goods or provide services.
Quantity standards indicate how much labor (i.e., in hours) or materials (i.e., in kilograms) should be used in manufacturing a unit of a product. In contrast, cost standards indicate what the actual cost of the labor hour or material should be. Standards, in essence, are estimated prices or quantities that a company will incur.
Related Reading
CFI is a global provider of the Financial Modeling & Valuation Analyst (FMVA)®Become a Certified Financial Modeling & Valuation Analyst (FMVA)®CFI's Financial Modeling and Valuation Analyst (FMVA)® certification will help you gain the confidence you need in your finance career. Enroll today! certification program and several other courses for finance professionals. To help you advance your career, check out the additional CFI resources below:
- Analysis of Financial StatementsAnalysis of Financial StatementsHow to perform Analysis of Financial Statements. This guide will teach you to perform financial statement analysis of the income statement,
- Financial Statement NormalizationNormalizationFinancial statements normalization involves adjusting non-recurring expenses or revenues in financial statements or metrics so that they only reflect the usual transactions of a company. Financial statements often contain expenses that do not constitute a company's normal business operations
- Financial Accounting TheoryFinancial Accounting TheoryFinancial Accounting Theory explains the why behind accounting - the reasons why transactions are reported in certain ways. This guide will
- Revenue Recognition PrincipleRevenue Recognition PrincipleThe revenue recognition principle dictates the process and timing by which revenue is recorded and recognized as an item in a company's
-

DuPont Analysis: A Comprehensive Guide to Profitability Assessment
In the 1920s, the management at DuPont Corporation developed a model called DuPont Analysis for a detailed assessment of the company’s profitability. DuPont Analysis is a tool that may help us t
-

Vertical Analysis: A Comprehensive Guide to Financial Statement Analysis
Vertical analysis is an accounting tool that enables proportional analysis of documents, such as financial statements. While performing a vertical analysis, every line item on a financial statement is
Accounting
- Budget Variance Explained: Causes, Types & Analysis
- Contribution Analysis: Understanding Profitability & Cost Management
- Credit Analysis: A Comprehensive Guide to Assessing Credit Risk
- Portfolio Variance: Understanding Risk and Diversification
- Quantitative Analysis: Definition, Methods & Applications
- Financial Analysis: A Comprehensive Guide for Professionals
- Revenue Variance Analysis: Understanding Sales Performance & Forecasting
- Understanding Variable Overhead Efficiency Variance: A Comprehensive Guide
- Variable Overhead Spending Variance: Definition & Analysis
-
 Managerial Accounting: Definition, Uses, and Differences from Financial Accounting
Managerial accounting (also known as cost accounting or management accounting) is a branch of accounting that is concerned with the identification, measurement, analysis, and interpretation of account...
-
 Understanding Variable Overhead Costs: A Comprehensive Guide
Variable overhead refers to the fluctuation in the manufacturing costs associated with the operation of businesses. To operate continuously, companies need to spend money on the production and sale of...