Revenue Variance Analysis: Understanding Sales Performance & Forecasting
Revenue Variance Analysis is used to measure differences between actual sales and expected sales, based on sales volumeDays Sales in Inventory (DSI)Days Sales in Inventory (DSI), sometimes known as inventory days or days in inventory, is a measurement of the average number of days or time metrics, sales mix metrics, and contribution margin calculations.
Information obtained from Revenue Variance Analysis is important to organizations because it enables management to determine actual sales performance in relation to the projected or perceived performance of the company for specific products. It helps businesses identify which products are performing better in the market. Overall, variance analysis helps management make better strategic and business-level decisions to maximize profitability.
Learn to perform revenue variance analysis in our online forecasting course.
Four Types of Revenue Variance
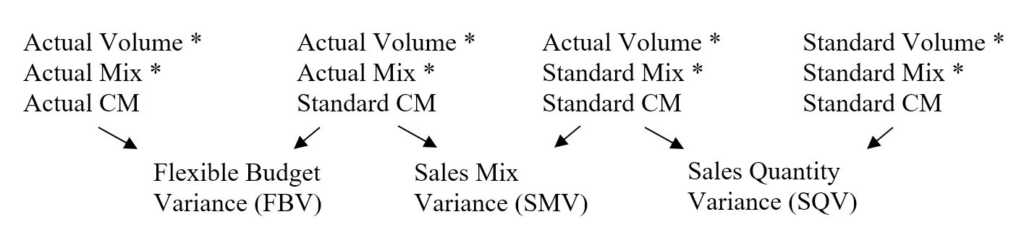
Similar to variance analysis, we can use the same column-based approach to calculate the four different types of revenue variance.
And finally, Sales Volume Variance (SVV) = Sales Mix Variance + Sales Quantity Variance.
These variances are summarized in the following table:
Flexible Budget Variance (FBV) Sales Mix Variance (SMV) Sales Quantity Variance (SQV) Difference between the actual contribution margin and the standard contribution with sales mix and sales volume held constantDifference between the actual product mix and the standard product mix with sales volume and contribution margin held constantDifference between the actual volume of sales and the standard (estimated) volume of sales with sales mix and contribution margin held constant
Example
Data from XYZ Company with equal Actual CM and Budgeted CM.
Standard Ticket Luxury Ticket Contribution Margin$20$5Budgeted tickets sold4,0006,000Actual seats sold3,3007,700
To determine the relevant variances, we use the column method shown above.
First, organize a table that outlines all relevant information regarding the two products.
Budget Actual VolumeSales Mix (%)CMVolumeSales Mix (%)CMStandard4,00040%$203,30030%$20Luxury6,00060%$57,70070%$5Total10,000100%11,000100%
Standard Ticket:
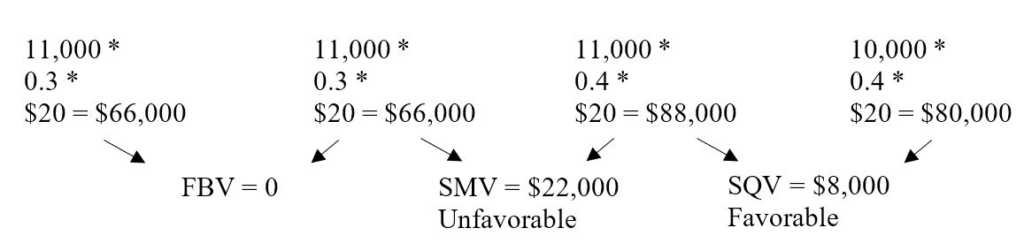
SVV = 22,000 U + 8,000 F = 14,000 U
Luxury Ticket:
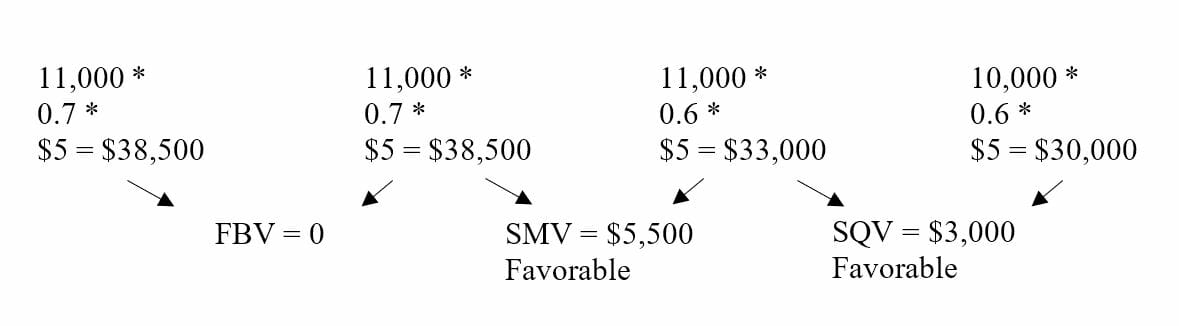
SVV = 5,500 F + 3,000 F = 8,500 F
Download the Free Template
Enter your name and email in the form below and download the free template now!
Analysis
From the above example, management can draw several conclusions:
- For the standard ticket, the actual sales mix is lower than originally budgeted, leading to an unfavorable sales mix variance.
- For the standard ticket, the actual sales volume is higher than originally estimated, leading to a favorable sales quantity variance.
- The sales volume variance, therefore, is unfavorable overall because the sales mix variance is significant.
- For the luxury ticket, the actual sales mix is higher than originally budgeted, leading to a favorable sales mix variance.
- For the luxury ticket, the actual sales volume is higher than estimated, leading to a favorable sales quantity variance
- The sales volume variance, therefore, is favorable overall and the luxury ticket proves to be performing better in terms of sales even though the contribution margin is lower.
- For both tickets, the flexible budget variance is 0 because the actual and budgeted CM are the same.
Market Share and Market Size Variances
Just like the variance analysis shown above, companies can also take their analysis one step further to determine market share and market size variances. Market share variance is the difference between actual market share and the estimated/standard market share at the same volume of sales.
On the other hand, market size variance is the difference between actual industry sales and estimated industry sales at a constant market share percentage. When the market shareMarket ShareMarket share refers to the portion or percentage of a market earned by a company or an organization. In other words, a company’s market share and market size variances are added together, they will be equal to the total sales quantity variance of all products sold by the company.
Learn to perform revenue variance analysis in our online budgeting course.
Importance of Variance Analysis
Variance analysis, as a whole, is imperative for companies because it gives management information that may not necessarily be obvious. By actually examining all individual costs, sales information, and contribution margin figures, companies can better measure the effectiveness of production methods and the performance of specific products relative to others.
For example, even though a certain product may provide a larger contribution marginContribution MarginContribution margin is a business’ sales revenue less its variable costs. The resulting contribution margin can be used to cover its fixed, leading to higher profitability, it may actually be performing worse than a lower contribution product. Although in the short run the higher CM product may be more appealing, companies should consider which products to focus their efforts on if they intend to maintain longevity in today’s highly competitive market.
Additional Resources
CFI offers the Financial Modeling & Valuation Analyst (FMVA)Become a Certified Financial Modeling & Valuation Analyst (FMVA)®CFI's Financial Modeling and Valuation Analyst (FMVA)® certification will help you gain the confidence you need in your finance career. Enroll today!®Become a Certified Financial Modeling & Valuation Analyst (FMVA)®CFI's Financial Modeling and Valuation Analyst (FMVA)® certification will help you gain the confidence you need in your finance career. Enroll today! certification program for those looking to take their careers to the next level. To help you advance your career, check out the additional CFI resources below:
- Sales RevenueSales RevenueSales revenue is the income received by a company from its sales of goods or the provision of services. In accounting, the terms "sales" and
- Analysis of Financial StatementsAnalysis of Financial StatementsHow to perform Analysis of Financial Statements. This guide will teach you to perform financial statement analysis of the income statement,
- Revenue Recognition PrincipleAnalysis of Financial StatementsHow to perform Analysis of Financial Statements. This guide will teach you to perform financial statement analysis of the income statement,
- Projecting Balance Sheet ItemsProjecting Balance Sheet Line ItemsProjecting balance sheet line items involves analyzing working capital, PP&E, debt share capital and net income. This guide breaks down how to calculate
-

Horizon Analysis: Predicting Portfolio Returns & Investment Strategies
Horizon analysis is a method used to estimate a portfolio’s expected total return over a given investment horizon. It uses scenario analysisScenario AnalysisScenario analysis is a process of exa
-

Accrued Revenue: Definition, Examples & Accounting Explained
Accrued revenue is revenue that has been earned by providing goods or services but the payment has yet to be received. In other words, cash collection will occur in a subsequent period after the goods
Accounting
- Sales Revenue Explained: Definition & Calculation | [Your Brand/Website]
- Total Sales Revenue: Definition & Importance | [Your Company Name]
- Ancillary Revenue: Definition, Examples & Maximization
- Marginal Revenue: Definition, Calculation & Importance
- Understanding Revenue: A Comprehensive Guide for Businesses
- Revenue Variance Analysis: Understanding Sales Performance & Forecasting
- Revenue vs. Income: Understanding the Key Differences
- Sales Revenue: Definition, Calculation & Importance
- Variance Analysis: Understanding & Improving Performance
-
 Financial Analysis: A Comprehensive Guide for Professionals
Financial analysis involves using financial dataFinancial DataWhere to find data for financial analysts - Bloomberg, CapitalIQ, PitchBook, EDGAR, SEDAR and more sources of financial data for financial...
-
 Fundamental Analysis: A Comprehensive Guide to Investment Valuation
In accounting and finance, fundamental analysis is a method of assessing the intrinsic valueIntrinsic ValueThe intrinsic value of a business (or any investment security) is the present value of all ex...