Understanding Confidence Intervals: A Statistics Guide for Finance
A confidence interval is an estimate of an interval in statisticsBasic Statistics Concepts for FinanceA solid understanding of statistics is crucially important in helping us better understand finance. Moreover, statistics concepts can help investors monitor that may contain a population parameter. The unknown population parameter is found through a sample parameter calculated from the sampled data. For example, the population mean μ is found using the sample mean x̅.
The interval is generally defined by its lower and upper bounds. The confidence interval is expressed as a percentage (the most frequently quoted percentages are 90%, 95%, and 99%). The percentage reflects the confidence level.

The concept of the confidence interval is very important in statistics (hypothesis testingHypothesis TestingHypothesis Testing is a method of statistical inference. It is used to test if a statement regarding a population parameter is correct. Hypothesis testing) since it is used as a measure of uncertainty. The concept was introduced by Polish mathematician and statistician, Jerzy Neyman in 1937.
How to Interpret a Confidence Interval
The proper interpretation of a confidence interval is probably the most challenging aspect of this statistical concept. One example of the most common interpretation of the concept is the following:
There is a 95% probability that, in the future, the true value of the population parameter (e.g., mean) will fall within X [lower bound] and Y [upper bound] interval.
In addition, we may interpret the confidence interval using the statement below:
We are 95% confident that the interval between X [lower bound] and Y [upper bound] contains the true value of the population parameter.
However, it would be inappropriate to state the following:
There is a 95% probability that the interval between X [lower bound] and Y [upper bound] contains the true value of the population parameter.
The statement above is the most common misconception about confidence interval. After the statistical interval is calculated, the interval can only either contain the population parameter or not. Nevertheless, the intervals may vary among the samples, while the true population parameter is the same regardless of the sample.
Therefore, the probability statement regarding the confidence interval can be made in the case when the confidence intervals are recalculated for the number of samples.
How to Calculate
The interval is calculated using the following steps:
- Gather the sample data.
- Calculate the sample mean x̅.
- Determine whether a population’s standard deviationStandard DeviationFrom a statistics standpoint, the standard deviation of a data set is a measure of the magnitude of deviations between values of the observations contained is known or unknown.
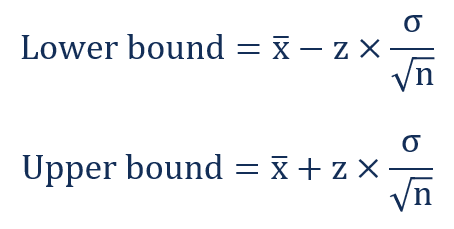
- If a population’s standard deviation is known, we can use a z-score for the corresponding confidence level.
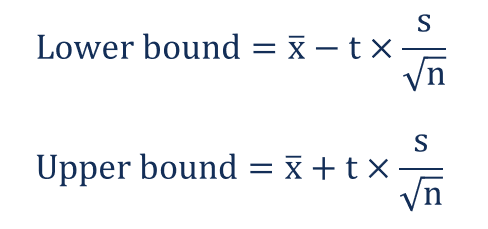
- If a population’s standard deviation is unknown, we can use a t-statistic for the corresponding confidence level.
- Find the lower and upper bounds of the confidence interval using the following formulas:
a. Known population standard deviation
b. Unknown population standard deviation
More Resources
CFI is the official provider of the Business Intelligence & Data Analyst (BIDA)®Become a Certified Business Intelligence & Data Analyst (BIDA)™From Power BI to SQL & Machine Learning, CFI's Business Intelligence Certification (BIDA) will help you master your analytical superpowers. certification program, designed to transform anyone into a world-class financial analyst.
To keep learning and developing your knowledge of financial analysis, we highly recommend the additional CFI resources below:
- Financial Math GlossaryFinancial Math GlossaryThis financial math glossary covers the most important terms and definitions required for a career as a financial analyst. This list is taken from CFI's Financial Mathematics Course.
- AlgorithmsAlgorithms (Algos)Algorithms (Algos) are a set of instructions that are introduced to perform a task. They automate trading to generate profits at a frequency impossible to a human trader.
- Geometric MeanGeometric MeanThe geometric mean is the average growth of an investment computed by multiplying n variables and then taking the n square root. It is the average return
- Quantitative FinanceQuantitative FinanceQuantitative finance is the use of mathematical models and extremely large datasets to analyze financial markets and securities. Common examples include (1) the pricing of derivative securities such as options, and (2) risk management, especially as it relates to portfolio management
-

Understanding Balanced Budgets: Definition & Importance
A balanced budget is a budgetOperating BudgetAn operating budget consists of revenues and expenses over a period of time, typically a quarter or a year, which a company uses to plan its operations. Do
-
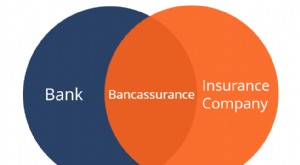
Bancassurance Explained: How Banks and Insurance Partner
Bancassurance refers to an agreement between a bank and an insurance company. In bancassurance, the insurance company can use the bank’s distribution channels to sell products. Banks, in return,
finance
- Interval Funds: Understanding Illiquidity & High Yields
- Understanding Account Balances: A Comprehensive Guide
- Understanding Account Numbers: Your Key to Financial Records
- Understanding Account Statements: A Comprehensive Guide
- Acquirer Definition: Understanding Corporate Acquisitions
- Defensive Interval Ratio (DIR): Understanding Company Liquidity
- Jumbo CDs: Higher Rates & Deposits Explained
- Understanding Regulation Z: Your Rights as a Borrower
- Annuities Explained: A Simple Guide to Retirement Income
-
 Understanding Auditors: Roles, Responsibilities & Audit Processes
An auditor is a person or a firm assigned to perform an audit on an organization. An audit is a structured, methodical process that includes an examination of books, accounts, records, or various docu...
-
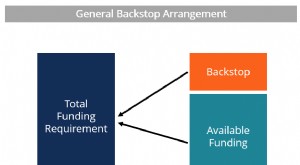 Backstop: Understanding Financial Safety Nets and Contingency Funding
A backstop is a financial arrangement that creates a secondary source of funds in case the primary source is not enough to meet current needs. It can also be thought of as an insurance policy that cov...