Defensive Interval Ratio (DIR): Understanding Company Liquidity
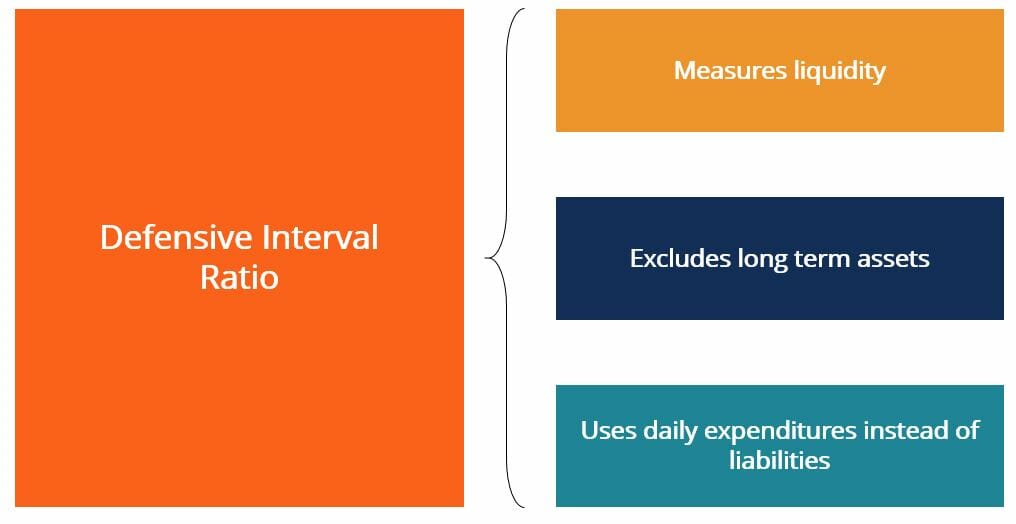
The defensive interval ratio (DIR) is a financial liquidity ratio that indicates how many days a company can operate without needing to tap into capital sources other than its current assetsCurrent AssetsCurrent assets are all assets that a company expects to convert to cash within one year. They are commonly used to measure the liquidity of a. It is also known as the basic defense interval ratio (BDIR) or the defensive interval period ratio (DIPR).
Sources of capital include long-term assets such as a company’s patents or PP&EPP&E (Property, Plant and Equipment)PP&E (Property, Plant, and Equipment) is one of the core non-current assets found on the balance sheet. PP&E is impacted by Capex, investments, which have relatively poor liquidity. This means they might take considerably more time to sell off at their fair market value.
Typically, long-term assets cannot be sold in the current accounting period. They usually take upwards of one year to liquidate. Examples of long-term, less liquid capital include a company’s external sources of capital that would require time to see cash flows from (e.g., issuing new debt or equity).
A key difference between the defensive interval ratio and other ratios is that the DIR does not compare the company’s current assets to current liabilitiesCurrent LiabilitiesCurrent liabilities are financial obligations of a business entity that are due and payable within a year. A company shows these on the. Rather, it compares the company’s current assets to the company’s daily cash expenditures. As a result, many analysts believe that it is a better ratio to utilize when assessing the liquidity of a specific company. The ratio is labeled “defensive” since it incorporates the company’s current assets, which are also called defensive assets.
How to Calculate the Defensive Interval Ratio
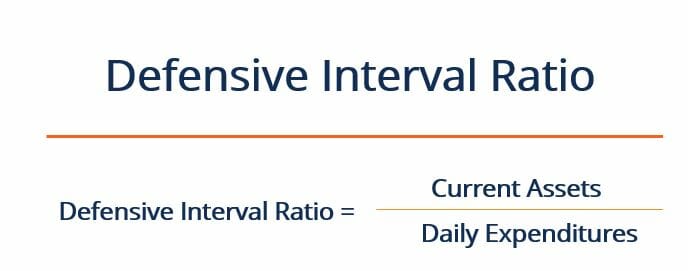
The defensive interval ratio is calculated by dividing the company’s current assets by its daily expenditures, as indicated below:
Where:
Current Assets = Cash + Accounts Receivable + Marketable Securities
Daily Expenditures = (Annual Operating Expenses – Non-cash Charges) / 365
Many analysts believe that the DIR is a better liquidity ratio to use than the classic quick ratioQuick RatioThe Quick Ratio, also known as the Acid-test, measures the ability of a business to pay its short-term liabilities with assets readily convertible into cash or current ratio. This is because the DIR measures a company’s short-term liquidity in regard to its daily expenditures.
Also, the DIR provides analysts with a number of days, rather than a ratio of the company’s assets to liabilities. This makes it easier to interpret as a measure of liquidity. Knowing that a company can remain liquid for “X” number of days without tapping into its long-term assets is an easily grasped point of reference. It provides a clearer, more definitive point of information than, for example, the knowledge that a company has a quick ratio that is greater than one.
That being said, the defensive interval ratio, by itself, does not provide significant context about the company’s situation. The ratio should be compared to the DIR of comparable companies in the same industry in order to gain insight into the company’s relative performance. The DIR can also be compared to the company’s own historical DIR to see the liquidity trend over time.
Defensive Interval Ratio Example
Suppose that a company currently has $40,000 in cash, $10,000 in accounts receivable, and $20,000 worth of available for sale securitiesAvailable for Sale SecuritiesAvailable for sale securities are the default categorization of securities that companies decide to invest in for the purposes of benefiting their financial position. Unlike trading securities, available for sale securities are not bought or sold for the sole purpose of realizing a short-term capital gain.. The company has $300,000 in annual operating expenses and incurs $25,000 in annual depreciation. What is its defensive interval ratio?
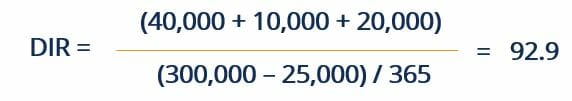
Using the equation above, we can see that this company has a DIR of 92.9 days. As always, this number does not mean much by itself and should be compared to the company’s historical DIRs and competitor DIRs in order to draw additional insights.
Additional Resources
Thank you for reading CFI’s explanation of the defensive interval ratio. CFI offers the Financial Modeling & Valuation Analyst (FMVA)™Become a Certified Financial Modeling & Valuation Analyst (FMVA)®CFI's Financial Modeling and Valuation Analyst (FMVA)® certification will help you gain the confidence you need in your finance career. Enroll today! certification program for those looking to take their careers to the next level. To learn more about related topics, check out the following CFI resources:
- How to Calculate Debt Service Coverage RatioHow to Calculate Debt Service Coverage RatioThis guide will describe how to calculate the Debt Service Coverage Ratio. First, we will go over a brief description of the Debt Service Coverage Ratio, why it is important, and then go over step-by-step solutions to several examples of Debt Service Coverage Ratio Calculations.
- Current Portion of Long-Term DebtCurrent Portion of Long-Term DebtThe current portion of long-term debt is the portion of long-term debt due that is due within a year’s time. Long-term debt has a maturity of
- IFRS StandardsIFRS StandardsIFRS standards are International Financial Reporting Standards (IFRS) that consist of a set of accounting rules that determine how transactions and other accounting events are required to be reported in financial statements. They are designed to maintain credibility and transparency in the financial world
- Cash Flow StatementCash Flow StatementA cash flow Statement contains information on how much cash a company generated and used during a given period.
-

Advertising to Sales Ratio: Measuring Ad Effectiveness & ROI
The advertising to sales ratio, also called the “A to S” for short, measures the effectiveness, or how successful, a company’s advertising strategiesAIDA ModelThe AIDA model, which s
-

Understanding the CAPE Ratio: A Guide to Cyclically Adjusted P/E
The CAPE Ratio (also known as the Shiller P/E or PE 10 Ratio) is an acronym for the Cyclically-Adjusted Price-to-Earnings Ratio. The ratio is calculated by dividing a company’s stock price by th
finance
- Acid-Test Ratio: Understanding Your Company's Short-Term Liquidity
- Asset Turnover Ratio: Definition & Calculation - Financial Analysis
- Current Ratio: Definition, Calculation & Financial Health
- Debt-to-Asset Ratio: Definition, Calculation & Significance
- Understanding the Envy Ratio in Private Equity
- Net Debt to EBITDA Ratio: Understanding Company Solvency
- Pretax Margin Ratio: Definition & Analysis | Financial Insights
- Times Interest Earned (TIE) Ratio: Calculation & Interpretation
- Receivables Turnover Ratio: Definition, Calculation & Importance
-
 Fixed-Charge Coverage Ratio (FCCR): Definition & Importance
The Fixed-Charge Coverage Ratio (FCCR) is a measure of a company’s ability to meet fixed-charge obligations such as interest expensesInterest ExpenseInterest expense arises out of a company that...
-
 Solvency Ratio: Understanding a Company's Financial Stability
A solvency ratio is a performance metric that helps us examine a company’s financial health. In particular, it enables us to determine whether the company can meet its financial obligations in t...