Understanding Swap Rate Curves: A Comprehensive Guide
The swap rate curve is a chart that depicts the relationship between swap rates and all available corresponding maturities. Essentially, it indicates the expected returnsExpected ReturnThe expected return on an investment is the expected value of the probability distribution of possible returns it can provide to investors. The return on the investment is an unknown variable that has different values associated with different probabilities. of a swap on different maturity dates. The curve can be considered as the swap’s equivalent of a bond’s yield curveYield CurveThe Yield Curve is a graphical representation of the interest rates on debt for a range of maturities. It shows the yield an investor is expecting to earn if he lends his money for a given period of time. The graph displays a bond's yield on the vertical axis and the time to maturity across the horizontal axis., and is a par curve, as it is based on par swapsSwapA swap is a derivative contract between two parties that involves the exchange of pre-agreed cash flows of two financial instruments. The cash flows are usually determined using the notional principal amount (a predetermined nominal value)..
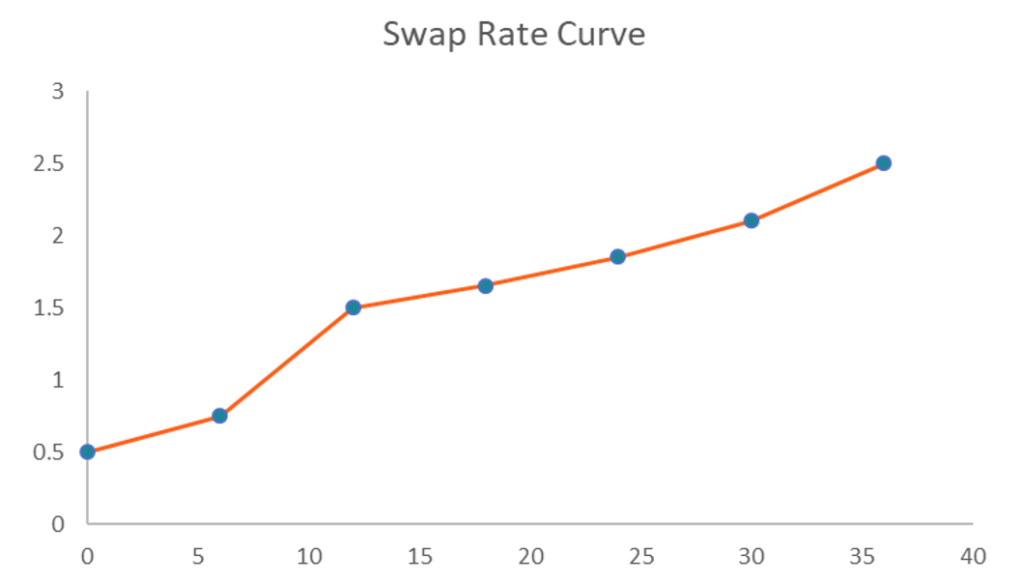
The swap rate curve is a two-dimensional plot drawn against the x-axis and y-axis. The swap rates are plotted against the y-axis while the times to maturity are drawn on the x-axis. Generally, the curve is upward sloping, since long-term swap rates tend to be higher than short-term rates.
Understanding the Swap Rate Curve
The swap rate curve is frequently drawn together with the yield curve of a government bond (e.g., US Treasury securitiesTreasury Bills (T-Bills)Treasury Bills (or T-Bills for short) are a short-term financial instrument issued by the US Treasury with maturity periods from a few days up to 52 weeks.). In some cases, the two curves may coincide, but they often diverge from each other. If the two curves diverge from each other, the swap spread is presented. Historical data shows that the swap rate curve tends to be above the yield curveYield CurveThe Yield Curve is a graphical representation of the interest rates on debt for a range of maturities. It shows the yield an investor is expecting to earn if he lends his money for a given period of time. The graph displays a bond's yield on the vertical axis and the time to maturity across the horizontal axis., thus indicating positive swap spreads.
The swap rate curve is extensively used in financial markets. For example, it is frequently used as a benchmark for interest rates. In addition, the curve can be utilized to assess market participants’ sentiment regarding the prevailing market conditions (particularly risk).
How to Create the Swap Rate Curve in Excel?
The curve can be easily created using Microsoft Excel. It can be done by following the steps below:
- Create a table that will contain the necessary information, including the swap rates and corresponding maturity dates.
- In the first column, list the swap rates.
- List the corresponding maturities in the second column.
- Using the mouse or keyboard, highlight the created table. Then, press Insert->Recommended Charts->All Charts->Line Chart and choose the chart with the single line. Alternatively, you can do it by pressing Insert->Scatter->Scatter with Straight Lines and Markers. Your swap rate curve should look like the chart in the image above.
Valuation
Swap contracts are traded in Over-The-Counter Markets (OTC).Over-the-Counter (OTC)Over-the-counter (OTC) is the trading of securities between two counter-parties executed outside of formal exchanges and without the supervision of an exchange regulator. OTC trading is done in over-the-counter markets (a decentralized place with no physical location), through dealer networks. As a swap contract comprises two legs, we must determine the present value of both legs to determine the value of the swap contract.
The fixed leg of interest rate swap Interest Rate SwapAn interest rate swap is a derivative contract through which two counterparties agree to exchange one stream of future interest payments for anothercontract, for example, is fairly simple to calculate, as future cash flows are set at inception. The floating leg requires a more complex calculation, as it is subject to change with the fluctuation of interest rates. The forward rate curve must be used to determine the forward rate of each future floating payment.
More Resources
CFI offers the Capital Markets & Securities Analyst (CMSA)®Program Page - CMSAEnroll in CFI's CMSA® program and become a certified Capital Markets &Securities Analyst. Advance your career with our certification programs and courses. certification program for those looking to take their careers to the next level. To keep learning and advancing your career, the following CFI resources will be helpful:
- Excel for FinanceExcel for FinanceThis Excel for Finance guide will teach the top 10 formulas and functions you must know to be a great financial analyst in Excel.
- SwapSwapA swap is a derivative contract between two parties that involves the exchange of pre-agreed cash flows of two financial instruments. The cash flows are usually determined using the notional principal amount (a predetermined nominal value).
- Swap SpreadSwap SpreadSwap spread is the difference between the swap rate (the rate of the fixed leg of a swap) and the yield on the government bond with a similar maturity. Since government bonds (e.g., US Treasury securities) are considered risk-free securities, swap spreads typically reflect the risk levels perceived by the parties involved in a swap agreement.
- Fixed Income Fundamentals Course
-

Understanding the Policy Interest Rate: Its Impact on the Economy
Three more sleep inducing words have perhaps never been strung together, but the policy interest rate is actually pretty exciting insofar as it's a little number that has a profound effect on a c
-
Understanding the Overnight Interest Rate: Impact on the Economy
Overnight rate might sound like the five-dollars-more alternative to the hourly rate for the least reputable hotel in town, but in fact it’s a number that has a profound effect on a country’s entire e
finance
- Understanding Forward Rates: A Comprehensive Guide
- Interest Rate Swaps: A Comprehensive Guide
- Understanding the Overnight Interest Rate: A Comprehensive Guide
- Prime Rate Explained: Understanding Interest Rates for Businesses & Consumers
- Swap Rate Explained: Understanding Fixed Exchange Rates in Derivatives
- Swap Spreads: Understanding the Difference and its Significance
- Understanding the Yield Curve: Definition & Significance
- Understanding the Credit Curve: A Guide for Investors
- Understanding Implied Rates: A Comprehensive Guide
-
 H-Model Explained: A Quantitative Stock Valuation Method
The H-model is a quantitative method of valuing a company’s stock priceStock PriceThe term stock price refers to the current price that a share of stock is trading for on the market. Every publi...
-
 Nominal Interest Rate Explained: Definition & Implications
The nominal interest rate refers to the rate of interest before adjusting for inflationInflationInflation is an economic concept that refers to increases in the price level of goods over a set period ...