Understanding the Credit Curve: A Guide for Investors
The credit curve is the graphical representation of the relationship between the return offered by a security (credit-generating instrument) and the time to maturity of the security. It measures the investors’ sentiments about riskSystematic RiskSystematic risk is that part of the total risk that is caused by factors beyond the control of a specific company or individual. Systematic risk is caused by factors that are external to the organization. All investments or securities are subject to systematic risk and therefore, it is a non-diversifiable risk. and can affect the return on investments. The difference between the first maturity on the curve (the short end) and the last maturity of the curve (on the long end) determines the steepness of the curve.
Understanding Credit Curves
- The steepness of the curve is usually greater (upward sloping) for companies in cyclical industries such as retail. It is because the probability that such companies will default over time is greater.
- Some companies show a flat curve; it is a sign that the probability of defaultProbability of DefaultProbability of Default (PD) is the probability of a borrower defaulting on loan repayments and is used to calculate the expected loss from an investment. is uniform over the different points of maturity.
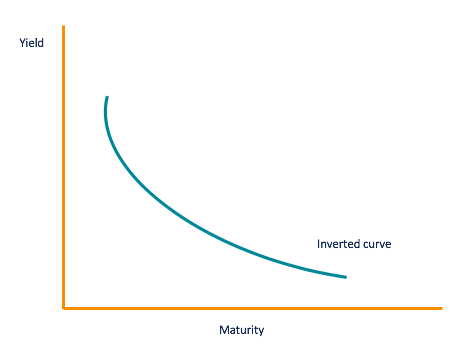
- A downward sloping or inverted curve shows that the company is likely to default in the near future but far less likely to default in the long term.
Types of Credit Curves
The credit curve reflects the immediate, short-term, and long-term rates of securities and gives the investor an indication of where the economy is headed. The curve can be normal, steep, or inverted.
1. Normal curve
Short-term bonds usually offer lower yields and therefore, lower risks. It is because when investors stay invested in a certain security for an extended period of time, they will be rewarded for their commitment. It is reflected in the normal yield curve where the slope moves upward. The normal curve also indicates that investors expect the economy to move at a normal pace with no significant turning points such as a recession or inflationInflationInflation is an economic concept that refers to increases in the price level of goods over a set period of time. The rise in the price level signifies that the currency in a given economy loses purchasing power (i.e., less can be bought with the same amount of money)..
2. Steep curve
When the credit spread becomes wider, it results in a steeper credit curve. It is also a sign that there will be economic growth or inflation in the economy. The curve becomes steeper right after the depression when the government lowers short-term interest ratesInterest RateAn interest rate refers to the amount charged by a lender to a borrower for any form of debt given, generally expressed as a percentage of the principal. to increase growth in the economy. During this time, long-term bondholders are at risk of getting locked into low rates, which can affect their purchasing power. As a result, they demand higher interest rates for their long-term commitment.
3. Inverted curve
Sometimes, the credit curve can be inverted when long-term bondholders are willing to settle for lower returns compared to short-term investors. It is because when long-term investors believe that the interest rates are going to fall even further, they become less demanding of the bond issuers.
The low interest rates are an indication that the will be a slowdown in the economy, which happens when the curve becomes inverted. Investors need to become alert when the curve is inverted as low interest rates will lead to a recession.
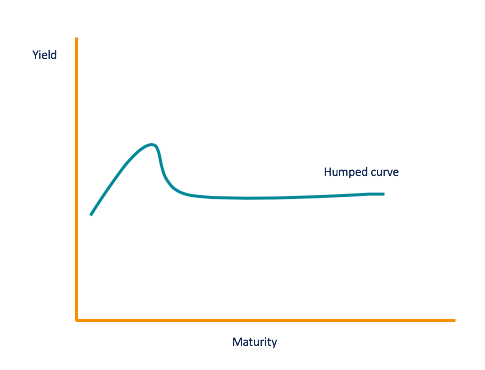
4. Humped curve
Before the credit curve becomes inverted, it goes through a phase where the short-term interest rate becomes close to the long-term interest rates. The curve that represents the phase is flat with a small elevation in the middle. It is known as a humped curve. However, not all humped curves turn into inverted curves, but it is a sign of an economic slowdown and low interest rates.
How are Credit Curves Used?
The credit curve shows a range of maturities at various interest rates. They can vary by investment. One of the most important uses of the yield curve is its ability to predict the movement and strength of the economy.
The Treasury yield curve is the most often used credit curve. It is used as a benchmark curve against which all other credit curves are measured. The yield of the Treasury curve is usually low as it is backed up by the government. However, it can be used as a benchmark for riskier bonds such as AAA-rated corporate bonds.
The difference between agency bonds and a government bond is called the “spread.” If the difference between the two is low, it makes the investor more confident in investing in the bond that is not backed by the government. The difference in the bonds (spread) is increases during a recession as agency bonds become riskier. It decreases when there is growth in the economy as the bonds are now safer to invest in.
Additional Resources
CFI is the official provider of the Financial Modeling and Valuation Analyst (FMVA)™Become a Certified Financial Modeling & Valuation Analyst (FMVA)®CFI's Financial Modeling and Valuation Analyst (FMVA)® certification will help you gain the confidence you need in your finance career. Enroll today! certification program, designed to transform anyone into a world-class financial analyst.
To keep learning and developing your knowledge of financial analysis, we highly recommend the additional resources below:
- Inverted Yield CurveInverted Yield CurveAn inverted yield curve often indicates the lead-up to a recession or economic slowdown. The yield curve is a graphical representation of the relationship between the interest rate paid by an asset (usually government bonds) and the time to maturity.
- Held to Maturity SecuritiesHeld to Maturity SecuritiesHeld to maturity securities are securities that companies purchase and intend to hold until they mature. They are unlike trading securities or available for sale securities
- Return on Investment (ROI)Return on Investment (ROI)Return on Investment (ROI) is a performance measure used to evaluate the returns of an investment or compare efficiency of different investments.
- Zero Lower BoundZero Lower BoundThe Zero Lower Bound refers to the belief that interest rates cannot be lowered beyond zero. Traditionally, central banks used monetary policy to manipulate the interest rate in the economy to meet their fiscal objective(s). Therefore, the banks would lower the interest rate during a recession
-

Credit Amnesty: Understanding the Truth & Avoiding Scams
Credit amnesty may not be as enticing as it sounds. This ruse is as old as the hills. While you'll see credit amnesty offers in television and radio advertising, you're most likely to
-

Understanding B Credit Ratings: What They Mean for Businesses
Corporations and other businesses must demonstrate their creditworthiness to potential lenders – and that's where credit rating agencies come in. Standard & Poor's (S&P), Moody's a
invest
- Understanding R1 & I1 Credit Report Codes: What They Mean
- Hope Credit: Understanding Your Post-Secondary Education Tax Credit
- Understanding Swap Rate Curves: A Comprehensive Guide
- Understanding the Yield Curve: Definition & Significance
- Understanding the Flat Yield Curve: Causes & Implications
- Understanding the Forward Curve: A Comprehensive Guide
- Understanding the Par Yield Curve: A Guide for Investors
- Understanding the Experience Curve: Cost Reduction & Efficiency
- Saver's Tax Credit: Eligibility, Contribution Limits & Benefits
-
 Intraday Credit: Understanding Short-Term Account Overdrafts
Intraday credits refer to short periods during which an account may be overdrawn. An intraday credit, also called a daylight credit, is a credit lasting less than one day given to a person or...
-
 Understanding Average Credit Scores: What You Need to Know
You have more than one credit score — and they might not all be the same. That makes trying to pinpoint the average credit score a challenge. But when people talk about average cre...