H-Model Explained: A Quantitative Stock Valuation Method
The H-model is a quantitative method of valuing a company’s stock priceStock PriceThe term stock price refers to the current price that a share of stock is trading for on the market. Every publicly traded company, when its shares are. The model is very similar to the two-stage dividend discount model. However, it differs in that it attempts to smooth out the growth rate over time, rather than abruptly changing from the high growth period to the stable growth period. The H-model assumes that the growth rate will fall linearly towards the terminal growth rate.

The majority of organizations increase or decrease dividends over time, as opposed to shifting rapidly from high yields to stable growth. Thus, the H-model was invented to approximate the value of a company whose dividend growth rate is expected to change over time.
Quick Summary
- The H-model is a quantitative method of valuing a company’s stock price.
- It is similar to the two-stage dividend discount model, but differs by attempting to smooth out the high growth rate period over time.
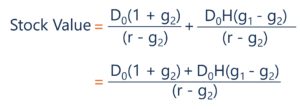
- The H-model formula is rendered as: ((D0(1+g2) + D0*H*(g1-g2))/(r-g2).
What is the Purpose of the H-Model?
The H-model is used to assess and value a company stock. The model, similar to the dividend discount model, theorizes the stock is worth the sum of all future dividend payments, discounted to the present value.
One potential problem with the two-stage dividend discount model is that it assumes an initial high growth rate, then an abrupt drop-off in growth to the terminal growth rateTerminal Growth RateThe terminal growth rate is the constant rate at which a firm’s expected free cash flows are assumed to grow, indefinitely. when the company reaches stable growth. The H-model, instead, smooths out the growth rate linearly toward the terminal growth rate. It thus provides a more realistic approach in most scenarios for valuing a company’s stock.
What is the H-Model Formula?
The H-model formula consists of two parts. The first component of the formula considers the value of the stock based on the long-term growth rate. It ignores the high growth rate period. The second component of the equation adds the value from the high growth rate period. The formula is then as follows:
Where:
- D0 = The most recent dividend payment
- g1 = The initial high growth rate
- g2 = The terminal growth rate
- r = The discount rateDiscount RateIn corporate finance, a discount rate is the rate of return used to discount future cash flows back to their present value. This rate is often a company’s Weighted Average Cost of Capital (WACC), required rate of return, or the hurdle rate that investors expect to earn relative to the risk of the investment.
- H = The half-life of the high growth period
Visually, we can see how the components of the H-model formula add up to the total value of the stock:
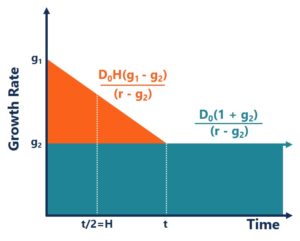
From the initial high growth rate (g1) to the stable growth rate (g2), we can see that under the H-model, the growth rate drops linearly until it hits the terminal growth rate. From there, the terminal growth rate is expected to hold indefinitely. The two components of the H-model formula make up the two parts that are considered in the stock valuation.
H-Model – Worked Example
Let us now work through a hypothetical situation that involves the H-model. A company recently issued a dividendDividendA dividend is a share of profits and retained earnings that a company pays out to its shareholders. When a company generates a profit and accumulates retained earnings, those earnings can be either reinvested in the business or paid out to shareholders as a dividend. of $3. The expected growth rate is 10%, and you expect the rate to fall to a stable growth rate of 2% over the next twelve years. If the required rate of returnRequired Rate of ReturnThe required rate of return (hurdle rate) is the minimum return that an investor is expecting to receive for their investment. Essentially, the required rate of return is the minimum acceptable compensation for the investment’s level of risk. is 11%, what would the value of a share in the hypothetical company be under the H-model?
We are given all the components that are used in the H-model, so, using the formula, we get:
Stock Value = (D0(1+g2))/(r-g2) + (D0*H*(g1-g2))/(r-g2)
Stock Value = ($3(1+0.02))/(0.11–0.02) + ($3*(12/2)*(0.10-0.02))/(0.11–0.02)
Stock Value = $50.00
The calculation above can also easily be done in Excel. The table below shows how Excel was used to calculate the resulting value. To the right of the calculation, the value is sensitizedWhat is Sensitivity Analysis?Sensitivity Analysis is a tool used in financial modeling to analyze how the different values for a set of independent variables affect a dependent variable based on the discount rate and terminal growth rate. Below the calculation, the graph shows the growth rate under the H-model:
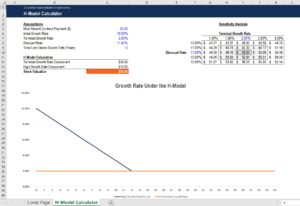
Here, we can see that the component corresponding to the terminal growth rate is $34. The component corresponding to the high growth rate is $16. The two parts combined give a per-share value of $50. To the right of the graph, the value has been sensitized based on the terminal growth rate and the discount rateDiscount RateIn corporate finance, a discount rate is the rate of return used to discount future cash flows back to their present value. This rate is often a company’s Weighted Average Cost of Capital (WACC), required rate of return, or the hurdle rate that investors expect to earn relative to the risk of the investment. used.
In the top left corner, we can see that the value could be as low as $42.27 if the discount rate was 12% and the terminal growth rate was 1%. Alternatively, if the discount rate was as low as 10% and the terminal growth rate was 3%, the value of the stock under the H-model would be $62.14.
Advantages of the H-Model
1. Consistency
One of the benefits of using the H-model is the fact that dividends remain steady over a long period. Usually, a company will experience fluctuation in certain measures, such as its total earnings and cash flow.
However, it always tries to ensure that dividends are obtained from the cash flow that it expects to achieve every year. For that reason, most companies never set an unrealistically high dividend target because if they fail to achieve it, that can cause a fall in their share price.
2. No bias
The main unit of measurement used in the H-model is the dividend. The good thing about that is that the definition of a dividend payment is the same for every company. However, the same cannot be said for many other measures. For example, what makes up “total earnings” may differ from one company to another.
3. Sign of maturity
The fact that shareholders continue to receive dividends year after year is an indication that the company has reached peak maturity. It shows that its operations are stable, and not much turbulence is likely to be experienced in the future. Thus, from an assessment point, it is much easier to calculate the discount rate since the model eliminates risk.
Additional Resources
Thank you for readings CFI’s article on the H-model. CFI offers the Financial Modeling & Valuation Analyst (FMVA)™Become a Certified Financial Modeling & Valuation Analyst (FMVA)®CFI's Financial Modeling and Valuation Analyst (FMVA)® certification will help you gain the confidence you need in your finance career. Enroll today! certification program for those looking to take their careers to the next level. To keep learning and advancing your career, the following CFI resources will be helpful:
- Gordon Growth ModelGordon Growth ModelThe Gordon Growth Model – also known as the Gordon Dividend Model or dividend discount model – is a stock valuation method that calculates a stock’s intrinsic value, regardless of current market conditions. Investors can then compare companies against other industries using this simplified model
- Multiple-Period Dividend Discount ModelMultiple-Period Dividend Discount ModelA multiple-period dividend discount model is a variation of the dividend discount model. It is often used in situations when an investor is expecting to buy
- Stock ValuationStock ValuationEvery investor who wants to beat the market must master the skill of stock valuation. Essentially, stock valuation is a method of determining the intrinsic value (or theoretical value) of a stock. The importance of valuing stocks evolves from the fact that the intrinsic value of a stock is not attached to its current price.
- Dividend Growth RateDividend Growth RateThe dividend growth rate (DGR) is the percentage growth rate of a company’s stock dividend achieved during a certain period of time. Frequently, the DGR is calculated on an annual basis. However, if necessary, it can also be calculated on a quarterly or monthly basis.
-

Applicable Federal Rate (AFR): Definition & How It Works
The applicable federal rate (AFR) is the interest rate that applies to personal loans. It is the minimum rate applicable to such loans under U.S. law. The AFR is implemented in the form of federal tax
-
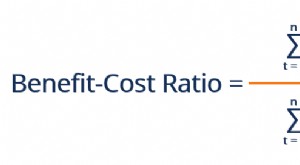
Benefit-Cost Ratio (BCR): Understanding & Calculation
The benefit-cost ratio (BCR) is a profitability indicator used in cost-benefit analysis to determine the viability of cash flows generated from an asset or project. The BCR compares the present value
finance
- Compound Growth Rate: Definition & Calculation | [Your Brand]
- Understanding Coupon Rate: A Key Bond Investment Metric
- Dividend Growth Rate (DGR): Definition & Calculation
- Understanding Forward Rates: A Comprehensive Guide
- Understanding the Overnight Interest Rate: A Comprehensive Guide
- Prime Rate Explained: Understanding Interest Rates for Businesses & Consumers
- Understanding Average Annual Growth Rate (AAGR): Definition & Uses
- Understanding Implied Rates: A Comprehensive Guide
- Prime Rate Explained: Understanding Interest Rates & Its Impact
-
 Understanding AER: Annual Equivalent Rate Explained
The Annual Equivalent Rate (AER) is the rate of interest after taking into account the effects of compounding to normalize the interest rateInterest RateAn interest rate refers to the amount charged b...
-
 Understanding the Overnight Interest Rate: Impact on the Economy
Overnight rate might sound like the five-dollars-more alternative to the hourly rate for the least reputable hotel in town, but in fact it’s a number that has a profound effect on a country’s entire e...