Understanding Average Daily Trading Volume (ADTV) | [Company Name/Website Name]
Average Daily Trading Volume (ADTV) is a technical indicator used by investors that refers to the number of shares of a particular stock that, on average, change hands during a single trading day. The average daily trading volume can be calculated for any span of time – five days, 10 days, etc. – but a commonly used ADTV measure is the average trading volume for a period of 20 or 30 days.
![Understanding Average Daily Trading Volume (ADTV) | [Company Name/Website Name]](https://www.etffin.com/Article/UploadFiles/202110/2021100815213088.jpeg)
Average daily trading volume can be tracked for a single stock, for options on a stock, or for market indexes such as the S&P 500S&P 500 IndexThe Standard and Poor’s 500 Index, abbreviated as S&P 500 index, is an index comprising the stocks of 500 publicly traded companies in the.
An alternative to the average daily trading volume indicator is the average daily value indicator. Average daily value is a computation of the average dollar amount of a stock that is, on average, traded daily.
Summary
- Average Daily Trading Volume (ADTV) refers to the number of shares of a particular stock that, on average, change hands during a single trading day.
- Significant deviations from the ADTV usually indicate greater or lesser buying or selling interest in the stock from large institutional investors.
- Average trading volume is an important indicator of liquidity for investors and support or resistance price levels.
Formula for Average Daily Trading Volume (ADTV)
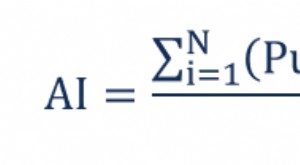
The formula for calculating the average daily trading volume of a stock is very simple. You just take the total trading volume for each day over the span of time that you want to compute the average volume for and divide that total by the number of trading days in that time span.
The total volume of a stock that is traded during each trading day is information that is freely available through virtually any stock trading or information center, such as your brokerage account or financial market information providers, such as Marketwatch, Google Finance, or Yahoo Finance.
![Understanding Average Daily Trading Volume (ADTV) | [Company Name/Website Name]](https://www.etffin.com/Article/UploadFiles/202110/2021100815213011.png)
- Where x is the number of days you want to calculate the average daily volume for (e.g., to get the 20-day average trading volume, x would equal 20)
To make things even simpler, there are volume technical indicators available that you can attach to a stock chart and simply set for the number of days you want to calculate the average daily trading volume. The technical indicator will then do the average volume calculation for you, updating it each new trading day.
Why Volume of Trading is Important to Investors
1. Indicates the overall level of interest in a stock
Stock market investors track the average daily trading volume for several important reasons. The first is that trading volume is an indicator of the overall level of interest in a stock shown by all potential stock traders.
An extremely low average trading volume for a stock indicates that not many investors are following or interested in the stock and that few, if any, large institutional investorsInstitutional InvestorAn institutional investor is a legal entity that accumulates the funds of numerous investors (which may be private investors or other legal entities) to are committed to an investment in the stock. It usually indicates that the consensus opinion of market analysts is that the stock shows little probability for significant price appreciation.
Conversely, a high average trading volume shows greater interest in the stock and is generally interpreted as meaning that many investors believe the stock will rise in price over time.
2. Indicates the trading liquidity in a stock
Average daily trading volume is also an indication of how liquid the trading in a stock is. Liquidity is important for investors because it impacts the bid and ask spread in the price of stock and, thereby, indicates how relatively easy or difficult it may be to initiate or exit a position in the stock at an investor’s desired price.
Stocks with relatively low trading volumes attract higher bid and ask spreads, making it more difficult to enter or exit the stock at your desired price. In contrast, stocks with consistently high average trading volume offer tighter bid-ask spreads, making it easier for an investor to enter or exit trading positions at their desired price.
3. Indicates the price levels that represent support or resistance for a stock
Finally, significant changes in volume often indicate to stock traders price levels that represent support or resistance for a stock.
For example, assume that the 20-day average daily trading volume for a given stock is approximately two million shares per day as the stock’s price rises from $50 a share to $70 a share over the course of several months. Then, as the price nears and then reaches $70, it subsequently sells off sharply, falling back to $65 during a trading day when the trading volume is six million shares – three times the average. It would indicate that $70 represents a level of significant price resistance.
Alternatively, if a stock that’s been declining in price for some period of time suddenly rises sharply and also shows a large increase in trading volume, it indicates that large institutional investors, such as mutual fundsMutual FundsA mutual fund is a pool of money collected from many investors for the purpose of investing in stocks, bonds, or other securities. Mutual funds are owned by a group of investors and managed by professionals. Learn about the various types of fund, how they work, and benefits and tradeoffs of investing in them or hedge funds, are buying the stock at that price level, thus making it a level of price support.
More Resources
CFI is the official provider of the global Capital Markets & Securities Analyst (CMSA)™Program Page - CMSAEnroll in CFI's CMSA® program and become a certified Capital Markets &Securities Analyst. Advance your career with our certification programs and courses. certification program, designed to help anyone become a world-class financial analyst. To keep advancing your career, the additional resources below will be useful:
- Advanced Technical AnalysisAdvanced Technical AnalysisAdvanced technical analysis usually involves using either multiple technical indicators or a rather sophisticated (i.e., complex) indicator. "Sophisticated"
- Dow Jones Industrial Average (DJIA)Dow Jones Industrial Average (DJIA)The Dow Jones Industrial Average (DJIA), also referred to as "Dow Jones” or "the Dow", is one of the most widely-recognized stock market indices.
- Options: Calls and PutsOptions: Calls and PutsAn option is a derivative contract that gives the holder the right, but not the obligation, to buy or sell an asset by a certain date at a specified price.
- Volume Price Trend Indicator (VPT)Volume Price Trend Indicator (VPT)The Volume Price Trend Indicator (VPT) is a stock market indicator that helps traders relate a stock's price and trading volume.
-

Understanding Stock Exchange Trading Mechanisms: NYSE vs. NASDAQ
Stock exchanges are organized to facilitate trading between buyers and sellers. The New York Stock Exchange and NASDAQ are the two major stock exchanges in the U.S. While they share many features, the
-
Understanding Average Inventory: Definition & Calculation
The average inventory is the mean value (that can be different from the median value) of an inventory during a determined period of time. The average inventory is thus a mathematical calculation. It e
invest
- FTSE 100 Trading Hours: A Complete Guide
- Understanding Stock Market Volume: A Comprehensive Guide
- Stock Halt Explained: Causes, Reasons & What It Means for Investors
- Understanding Stock Tickers: A Comprehensive Guide
- Understanding Trading Halts: Causes & Implications
- Understanding Trading Volume: A Key Market Indicator
- Understanding Average Daily Rate (ADR): A Key Hospitality Metric
- Average Daily Trading Volume (ADTV): Definition & Significance
- Top Stock Trading Software: Reviews & Comparison - [Year]
-
 Understanding Quoted Prices: A Comprehensive Guide
The quoted price is the most recent – or last – price at which a financial assetFinancial AssetsFinancial assets refer to assets that arise from contractual agreements on future cash flows...
-
 Understanding the Stock Market: A Beginner's Guide
The stock market refers to public markets that exist for issuing, buying, and selling stocks that trade on a stock exchange or over-the-counter. StocksStockWhat is a stock? An individual who owns stoc...