Understanding Stock Tickers: A Comprehensive Guide
A ticker is a symbol, a unique combination of letters and numbers that represent a particular stockStockWhat is a stock? An individual who owns stock in a company is called a shareholder and is eligible to claim part of the company’s residual assets and earnings (should the company ever be dissolved). The terms "stock", "shares", and "equity" are used interchangeably. or security listed on an exchange. The symbol is used to refer to a specific stock, particularly during trading. Trades are executed based on a company’s ticker symbol, which is recorded in the exchange’s trading systemTrading MechanismsTrading mechanisms refer to the different methods by which assets are traded. The two main types of trading mechanisms are quote driven and order driven trading mechanisms. The system will find the stock easily when the ticker symbol is entered.
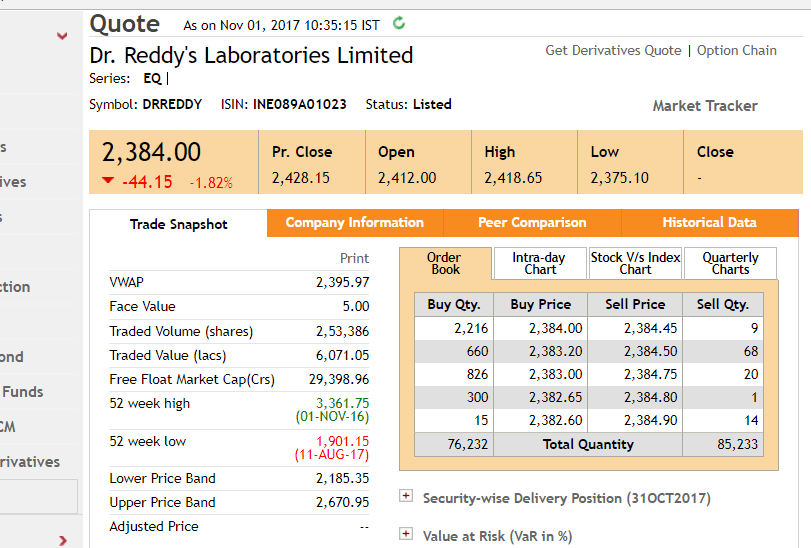
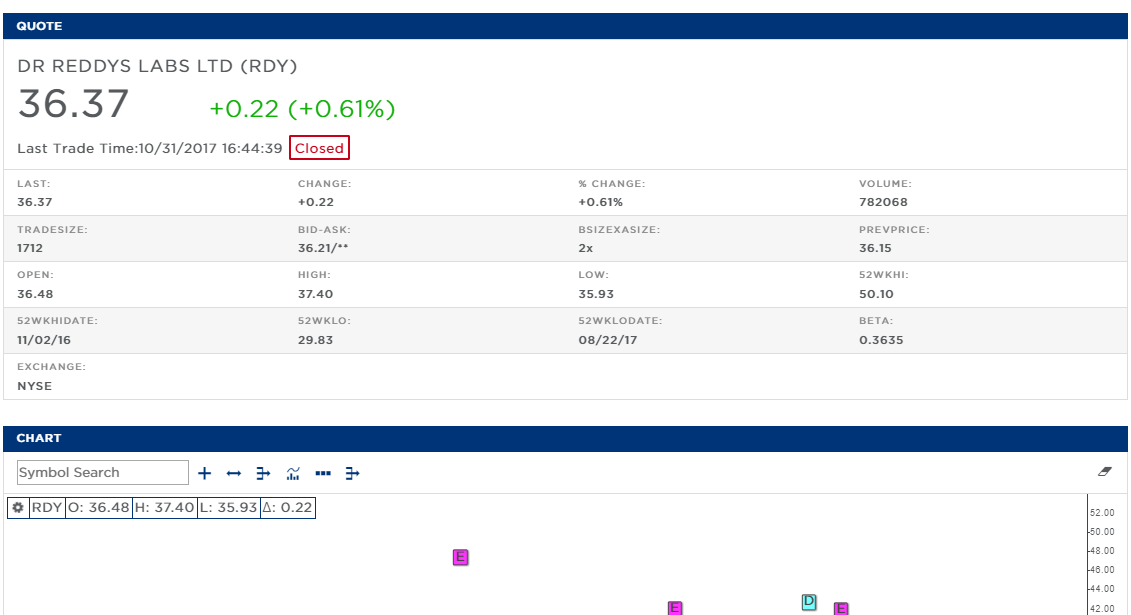
Shares of the same company can be traded on several exchanges, but they will have different stock ticker symbols for each different exchange the stock is traded on. The two images above and below show us the difference between two symbols for the same stock that is trading on two different exchanges. For the stocks of Indian pharmaceutical firm, Dr. Reddy’s Laboratories, the ticker symbol is DRREDDY on the Indian stock exchange, NSE, and RDY on the US stock exchange, NYSEDow Jones Industrial Average (DJIA)The Dow Jones Industrial Average (DJIA), also referred to as "Dow Jones” or "the Dow", is one of the most widely-recognized stock market indices..
Purpose of Ticker Symbols
Ticker symbols are used on stock exchanges because they are easy abbreviations that are useful to investors and analysts to help them identify stocks and obtain all relevant information such as stock split, dividend data, earnings reports, etc. There are some companies that trade with two different symbols on the same stock market because they offer two classes of shares, one with voting rights and another without voting rights.
An example is Alphabet, formerly known as Google, which trades under the symbols GOOGL and GOOG, representing the company’s class A shares and class C shares, respectively. The symbols also help in identifying the type of shares traded on different stock exchanges. They are presented in different patterns in different indices, which makes them easy to find on trading sites and stock exchange websites.
Ticker Symbol Example
The shares of Berkshire Hathaway are traded with two stock symbols, representing its two classes of shares that are traded on the NYSE – class A and class B with ticker symbols BRK.A and BRK.B, respectively. Class A shares provide shareholders with more voting rights compared to class B shares. This type of classification is necessary to avoid confusion. To clearly classify the types of stocks, it is necessary to use different symbols.
More Readings
CFI is a global provider of financial analyst training and oversees the Financial Modeling & Valuation Analyst (FMVA)™Become a Certified Financial Modeling & Valuation Analyst (FMVA)®CFI's Financial Modeling and Valuation Analyst (FMVA)® certification will help you gain the confidence you need in your finance career. Enroll today! certification program. To continue advancing your career in corporate finance, these additional resources will be helpful:
- Investing: A Beginner’s GuideInvesting: A Beginner's GuideCFI's Investing for Beginners guide will teach you the basics of investing and how to get started. Learn about different strategies and techniques for trading
- Stock MarketStock MarketThe stock market refers to public markets that exist for issuing, buying and selling stocks that trade on a stock exchange or over-the-counter. Stocks, also known as equities, represent fractional ownership in a company
- How to Read Stock ChartsHow to Read Stock ChartsIf you’re going to actively trade stocks as a stock market investor, then you need to know how to read stock charts. Even traders who primarily use fundamental analysis to select stocks to invest in still often use technical analysis of stock price movement to determine specific buy and sell, stock charting
- Daily Trading LimitDaily Trading LimitThe daily trading limit refers to the maximum amount by which the price of a stock or other exchange-traded security can rise or fall during a trading session. The limits are decided by the exchange in an attempt to avoid extreme volatility or manipulation in the markets.
-

Understanding Trading Sessions: Hours & Global Markets
A trading session refers to the active trading hours of an asset or a given locale. Usually, different markets follow different trading hours, and a single trading day of a market is the trading sessi
-
Trading Software: A Comprehensive Guide for Traders
Trading software are computer programs that traders use to trade and analyze financial products such as currencies, stocks, bonds, and derivatives over a network with a financial intermediaryFinancial
invest
- CFD Trading Explained: A Comprehensive Guide for Investors
- Day Trading Explained: Strategies, Risks & How It Works
- Understanding Downtrends: Definition, Identification & Reversal
- Understanding Non-Assessable Stock: Limited Liability Explained
- Stock Halt Explained: Causes, Reasons & What It Means for Investors
- Stock Symbols (Ticker Symbols): A Comprehensive Guide
- Understanding Trading Halts: Causes & Implications
- Trend Trading: A Comprehensive Guide for Investors
- Extended Trading Explained: Strategies & Opportunities
-
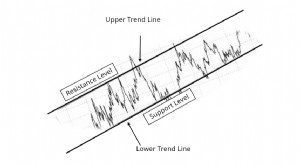 Trading Channels: Understanding Uptrends & Downtrends
A trading channel is a chart pattern highlighted by two parallel lines bordering resistance and support within which a security trades during a period. Within a valid uptrend trading channel, an oppor...
-
 Trading Plan: A Comprehensive Guide to Successful Trading
A trading plan refers to a systematic approach used to identify and trade securities based on several variables, such as investment objectives, risks, and time. A trading plan lays out procedures and ...