Hikkake Pattern: A Trader's Guide to Short-Term Trend Identification
A hikkake pattern, simply known as a hikkake, is a candlestick pattern used by traders to identify a short-term trend in a stock priceDow Jones Industrial Average (DJIA)The Dow Jones Industrial Average (DJIA), also referred to as "Dow Jones” or "the Dow", is one of the most widely-recognized stock market indices.. The hikkake pattern was developed by Daniel L. Chelser, a Chartered Market Technician (CMT).
Summary
- A hikkake pattern is used to identify a short-term trend in a stock price.
- There are two variants to the hikkake pattern – a bullish hikkake pattern and a bearish hikkake pattern.
- The bullish and bear hikkake patterns illustrate the same concept of a short-term decrease in market volatility, followed by a breakout.
Understanding the Hikkake Pattern
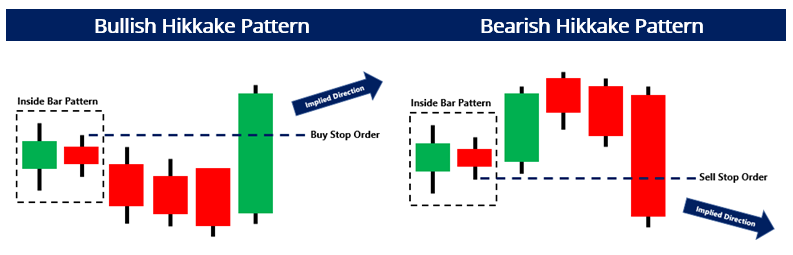
Hikkake is a Japanese word that means to catch, trick, or ensnare. As such, the hikkake pattern conveys just that – a candle pattern that moves in one direction but quickly reverses in the opposite direction, ensnaring traders on the wrong side of the trade. The hikkake pattern comes in two variants – a bullish hikkake pattern and a bearish hikkake pattern.
1. Bullish Hikkake Pattern
A bullish hikkake pattern is identified as follows:
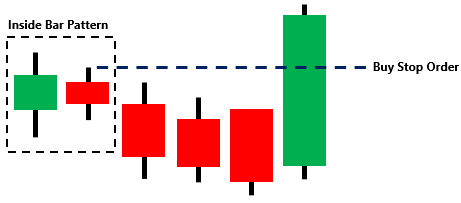
- An initial “inside bar” pattern. It refers to a two-bar pattern where the first bar completely overshadows the body of the second bar.
- The third bar includes a lower high and lower low than the second bar.
- The fourth bar, or the fourth and fifth bars, drifts below the third bar.
- The fifth or sixth bar’s body closes above the second bar’s high.
To profit from a bullish hikkake pattern, the trader would place a buy stop orderStop OrderA stop order is a contingent order that an investor utilizes to either enter or exit a market position. A stop order is activated, or at the high of the second bar (the bar is called the inside bar). A buy stop order is an order to purchase a security once a certain price is hit.
It should be noted that a bullish hikkake pattern ignores the positions of the open and close of the bars. In other words, whether the bar is red (open price is higher than close price) or green (open price is lower than close price) is irrelevant.
2. Bearish Hikkake Pattern
A bullish hikkake pattern is identified as follows:
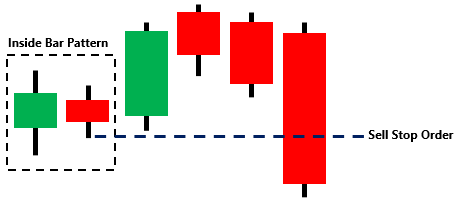
- An initial “inside bar” pattern (the first bar completely overshadows the second bar).
- The third bar includes a higher high and higher low than the second bar.
- The fourth bar, or the fourth and fifth bars, drifts above the third bar.
- The fifth or sixth bar’s body closes below the second bar’s low.
To profit from a bearish hikkake pattern, the trader would place a sell stop order at the low of the second bar. Similar to the bullish hikkake pattern, the bearish hikkake pattern ignores the positions of the open and close of the bars.
Interpreting the Hikkake Pattern
The bullish and bearish hikkake patterns illustrate the same concept of a short-term decrease in market volatility, followed by a breakout. Once a hikkake pattern is established, whether bullish or bearishBullish and BearishProfessionals in corporate finance regularly refer to markets as being bullish and bearish based on positive or negative price movements. A bear market is typically considered to exist when there has been a price decline of 20% or more from the peak, and a bull market is considered to be a 20% recovery from a market bottom., the implied forecast is a continuation of that move. The hikkake pattern is not guaranteed to pay out its correct forecast direction.
Example of the Hikkake Pattern
Consider the following ten candlesticks:
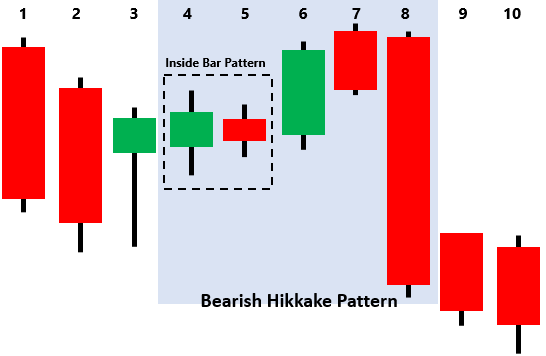
Question: Is there an identifiable hikkake pattern? If so, did the implied forecast of the hikkake pattern play out?
Answer: To identify a potential hikkake pattern, first identify whether there is an inside bar pattern. An inside bar pattern is identified for bars four and five. The following bar, the sixth bar, includes a higher open and higher close than the fifth bar, setting up a potential bearish hikkake pattern. The pattern is confirmed as the seventh bar drifts above the sixth bar, and the eighth bar’s body closes below the fifth bar’s low.
The implied forecast of the bearish pattern played out, as the following bars (ninth and tenth bars) is a continuation.
Additional Resources
CFI is the official provider of the global Capital Markets & Securities Analyst (CMSA)®Program Page - CMSAEnroll in CFI's CMSA® program and become a certified Capital Markets &Securities Analyst. Advance your career with our certification programs and courses. certification program, designed to help anyone become a world-class financial analyst. To keep advancing your career, the additional CFI resources below will be useful:
- Double TopDouble TopCommon in financial trading, the double top is a type of chart pattern that can be found when performing technical analysis. The chart
- Evening Star PatternEvening Star PatternThe Evening Star pattern is a type of reversal pattern of asset price charts. It usually appears at the top of an uptrend and is a bearish
- Hanging Man CandlestickHanging Man CandlestickThe “hanging man” is a bearish financial candlestick pattern that represents a potential reversal in an uptrend. In particular, a hanging man
- Advance Technical AnalysisAdvanced Technical AnalysisAdvanced technical analysis usually involves using either multiple technical indicators or a rather sophisticated (i.e., complex) indicator. "Sophisticated"
-
Arbitrage Explained: Understanding and Capitalizing on Price Differences
Arbitrage is the strategy of taking advantage of price differences in different markets for the same assetTypes of AssetsCommon types of assets include current, non-current, physical, intangible, oper
-

Understanding Auction Markets: How Prices Are Determined
An auction market is a market where the price is determined by the highest price the buyer is willing to pay (bids), and the lowest price the seller is willing to take (offers). Bids and offers are ma
invest
- PC Banking: A Comprehensive Guide to Online Banking Security & Features
- IRA CDs: Secure Retirement Savings with FDIC Insurance
- Evening Star Pattern: Meaning, Interpretation & Trading Signals
- Fractal Indicator: Identify Trend Reversals in Trading
- Impulse Wave Pattern: Understanding Elliott Wave Theory
- Kicker Pattern: Definition, Identification & Trading Strategies
- Understanding Cryptocurrency: A Beginner's Guide to Digital Currency
- Pattern Day Trading: Definition, Rules & Requirements - Investopedia
- Pattern Day Trading: Definition, Rules & Requirements
-
 Anchoring Bias: Understanding How First Impressions Influence Decisions
Anchoring bias occurs when people rely too much on pre-existing information or the first information they find when making decisions. For example, if you first see a T-shirt that costs $1,200 – ...
-
 Annuities Explained: A Simple Guide to Retirement Income
So you're wondering what is an annuity? There are dozens of different flavours of annuities that perform different functions and pay their holders out in different ways, but for our purposes let’...