Kicker Pattern: Definition, Identification & Trading Strategies
A kicker pattern is a security’s price charting pattern that is identified by a drastic reversal in price over the span of its distinct two-bar candlestick formation. Kicker patterns are prominent in the technical analysisTechnical Analysis - A Beginner's GuideTechnical analysis is a form of investment valuation that analyses past prices to predict future price action. Technical analysts believe that the collective actions of all the participants in the market accurately reflect all relevant information, and therefore, continually assign a fair market value to securities. world because they act as predictors for changes in the direction of an asset’s price forecast.

The kicker pattern is severely magnified when it is seen in oversold and overbought markets. The impact of a kicker pattern suggests that large players in the financial market may be changing or altering their opinions on a security.
In most cases, the opinions of large players in the financial market are swayed during some news event or release of information. For example, if a CEO were to openly express a controversial political belief, investors may react strongly to sell or buy the underlying stock.
The two primary kicker patterns that are prominent in the financial market today are referred to as “bullish kicker patterns” and “bearish kicker patterns.”
Bull Market vs. Bear Market
In order to grasp the concept of the two most important kicker patterns in technical analysis, it is important to first understand the difference between a bull market and a bear market.
The animal reference taken on by the financial terms directly relates to the categorization of competing buyers (bulls) and sellers (bears) in the financial market.
Bull Market
Simply, a bull market is a market that shows uptrend expectations. Markets consist of large financial indexes, such as the S&P 500S&P 500 IndexThe Standard and Poor’s 500 Index, abbreviated as S&P 500 index, is an index comprising the stocks of 500 publicly traded companies in the, NASDAQ, and the Dow Jones. The indexes are seen as bull markets when the price is rising.
The common characteristics of a bull market include:
- Investors buying more stock: If prices are rising and investors are convinced they will keep rising, additional stock will be purchased.
- Unemployment rates drop: As unemploymentUnemploymentUnemployment is a term referring to individuals who are employable and actively seeking a job but are unable to find a job. Included in this drops, average wage increases making companies compete for work and workers searching for higher-paying jobs.
- Companies allocate towards future growth: As consumers spend more, organizations put more of that profit into investments that improve the financial standing of the business as a whole.
Bear Market
Opposite to a bull market, a bear market is when the market declines.
The common characteristics of a bear market include:
- Investors become pessimistic: Once investors do not see any more potential in a stock, they become pessimistic and sell, decreasing the price.
- Investors see a capped market: If the market is believed to hit a cap and will not continue to grow, players will sell, which will, in turn, decrease the price.
- Companies make less money: With less capital being circulated in the business, the overall valuation of the company drops which ultimately decreases the price of their stock.
Bullish Kicker Pattern vs. Bearish Kicker Pattern
Within the technical analysis world, there are two defined forms of kicker patterns that predict changes in an asset’s price.
1. Bullish Kicker Patterns
A bullish kicker pattern indicates that the stock prices could be on the rise. Such an arrangement can be seen below:
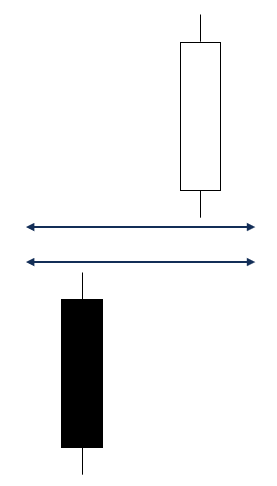
As shown, a bullish kicker pattern starts with a black (bearish) candlestick, which is then followed by a white (bullish) candlestick that opens above the black candlestick, creating a large upward gap.
The general consensus between tradersSix Essential Skills of Master TradersJust about anyone can become a trader, but to be one of the master traders takes more than investment capital and a three-piece suit. Keep in mind: there is a sea of individuals looking to join the ranks of master traders and bring home the kind of money that goes with that title. is that the bullish kicker pattern is one of the most powerful and influential tools in technical analysis.
The one downside to the bullish kicker pattern is that they are extremely rare and only occur in very distinct situations and events.
2. Bearish Kicker Patterns
Opposite from a bullish pattern, a bearish kicker pattern indicates that the stock prices could be on the decline. Such an arrangement is illustrated below:
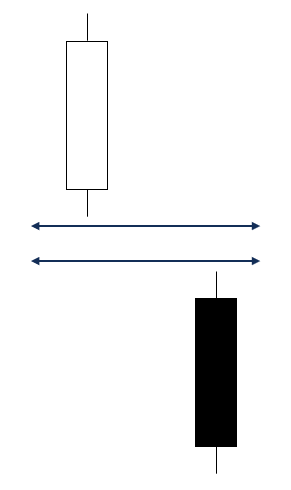
As shown, a bearish kicker pattern starts with a white (bullish) candlestick which is then followed by a black (bearish) candlestick that opens below the white candlestick, creating a large downward gap.
The bearish kicker pattern emphasizes the abruptness of the change in investor attitude.
More Resources
CFI is the official provider of the global Capital Markets & Securities Analyst (CMSA)®Program Page - CMSAEnroll in CFI's CMSA® program and become a certified Capital Markets &Securities Analyst. Advance your career with our certification programs and courses. certification program, designed to help anyone become a world-class financial analyst. To keep advancing your career, the additional CFI resources below will be useful:
- Advanced Technical AnalysisAdvanced Technical AnalysisAdvanced technical analysis usually involves using either multiple technical indicators or a rather sophisticated (i.e., complex) indicator. "Sophisticated"
- Bullish and BearishBullish and BearishProfessionals in corporate finance regularly refer to markets as being bullish and bearish based on positive or negative price movements. A bear market is typically considered to exist when there has been a price decline of 20% or more from the peak, and a bull market is considered to be a 20% recovery from a market bottom.
- Candlestick PatternsCandlestick PatternsCandlestick patterns are a financial technical analysis tool that depict daily price movement information that is shown graphically on a candlestick chart.
- Technical IndicatorTechnical IndicatorA technical indicator is a mathematical pattern derived from historical data used by technical traders or investors to predict future price
-
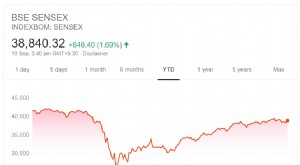
Sensex Explained: Understanding India's Key Stock Market Index
Sensex, also known as the S&P BSE Sensex Index, is the benchmark index that tracks India’s Bombay Stock Exchange (BSE). The Sensex is composed of the 30 largest and most-traded stocks within
-

Understanding Algorithmic Trading Spoofing: Definition & Impact
Spoofing is a disruptive algorithmic trading practice that involves placing bids to buy or offers to sell futures contractsFutures ContractA futures contract is an agreement to buy or sell an underlyi
invest
- Understanding Auction Markets: How Prices Are Determined
- Doji Candlestick Pattern: Meaning & Trading Signals
- Understanding Frothy Markets: Risks & Opportunities
- Hikkake Pattern: A Trader's Guide to Short-Term Trend Identification
- Understanding Inefficient Markets: Causes & Implications
- Understanding Market Cycles: Trends & Economic Environments
- Understanding Market Depth: A Guide for Traders
- Understanding Market Exposure: Risk & Portfolio Allocation
- Understanding Market Indexes: A Comprehensive Guide
-
 Understanding Stock Rallies: Definition & What Causes Them
A rally refers to a period of continuous increase in the prices of stocks, indexes or bondsBondsBonds are fixed-income securities that are issued by corporations and governments to raise capital. The ...
-
 Understanding Secular Markets: Long-Term Trends & Investment Strategies
A secular market is predominantly driven and impacted by elements or forces that are likely to be present in the foreseeable future. The forces can impact the price or value of a financial assetFinanc...