Evening Star Pattern: Meaning, Interpretation & Trading Signals
The Evening Star pattern is a type of reversal pattern of asset price charts. It usually appears at the top of an uptrend and is a bearish signal. Traders do not commonly see an Evening Star pattern, but it is a reliable indicator for technical analysisTechnical Analysis - A Beginner's GuideTechnical analysis is a form of investment valuation that analyses past prices to predict future price action. Technical analysts believe that the collective actions of all the participants in the market accurately reflect all relevant information, and therefore, continually assign a fair market value to securities..
Summary
- The Evening Star pattern is a technical analysis tool that signals an upward price momentum’s reversal to bearish momentum. The pattern rarely appears, but it is considered a reliable bearish indicator.
- The Morning Star pattern is also a trend-reversal pattern, which is bullish and gives a buying signal.
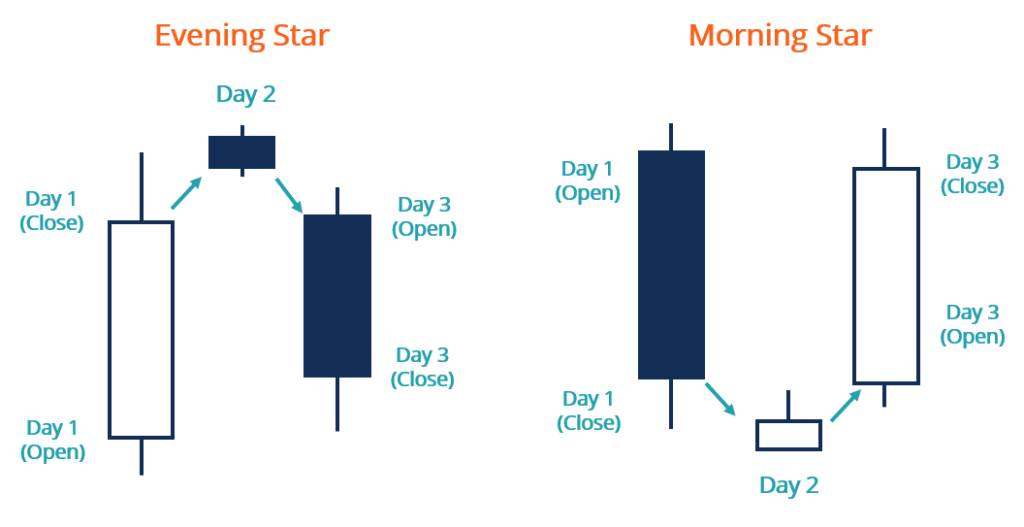
- An Evening Star pattern consists of a long bullish candle, a “star” with a short body or nobody, and a bearish confirmation candle.
Understanding Evening Star Patterns
An Evening Star pattern can be observed in a candlestick chart of an asset price, consisting of three candles. The first one is a long-body candle, representing a large rise in price with the close price settling above the open price. This bullish candle reflects an upward momentum of the asset price.
The second candle is the “star” with a small body (either bullish or bearishBullish and BearishProfessionals in corporate finance regularly refer to markets as being bullish and bearish based on positive or negative price movements. A bear market is typically considered to exist when there has been a price decline of 20% or more from the peak, and a bull market is considered to be a 20% recovery from a market bottom.) or without a body (neutral). The star feature indicates that the asset price closes at the level very close to the open price with balanced buying and selling orders. The star signals a slow-down in the previous bullish momentum. There should be a gap up from the first candle to the star in an ideal Evening Star pattern. It means that the open price increased rapidly from the preceding close price with very few or even no transactions happening in the meanwhile.
Typically with a gap down from the preceding star, the third candle is bearish, with the close price lower than the open price. The upward trend shown in the first candle has been reversed, and the price gain has been eliminated. This candle confirms the Evening Star pattern (ideally with a gap down) and gives a selling signal.
The characteristics of candle bodies are more essential than those of candle shadows. The shadow is the lines above and below a candle body and reveals the highest and lowest prices during a certain period. A longer shadow indicates a greater fluctuation of price, vice versa. While identifying an Evening Star pattern, analysts pay more attention to the open and close prices rather than the trading range of that day.
What Does an Evening Star Pattern Tell?
The Evening Star pattern is a useful tool for technical analysis, as it can predict investor sentiment and change in price momentum.
As discussed above, an Evening Star pattern consists of three candles, one for each day. On the first day, with a long bullish candle, the asset price moves upward with strong momentum. After a sudden increase in price reflected by a gap up, the momentum starts to weaken on the second day when the star appears.
However, the second day is still an indecision day between the bullish and bearish sentiment. If there is a gap down as the market opens on the third day, it is an indication that the momentum will be reversed, signaling traders to make a short decision. When the price closes much lower at the end of the third day, an Evening Star pattern is thus confirmed.
Evening Star vs. Morning Star Patterns
In contrast to the Evening Star pattern, a Morning Star pattern signals a trend reversal from bearish to bullish. The first candle of a Morning Star pattern is a long bearish candle, indicating a downward price momentum. The “morning star” is a short-body (either bullish or bearish) or DojiDojiA Doji is a uique pattern in a candlestick chart, a common chart type for trading. It is characterized by having a small length, which candle.
The third candle is a bullish one, which confirms the reversal and covers most of the first candle loss. Ideally, there is a gap down from the first candle to the morning star, a gap up from the morning star to the confirmation candle.
Besides the Evening Star and Morning Star, there are also other Star patterns. All the other Star patterns are reversal patterns that can help traders make buy or sell decisions. Although there’s always been a dispute regarding whether technical analysis can be a profitable investment tool, the Evening Star pattern is regarded as a reliable tool that predicts a bearish momentum.
Additional Resources
CFI is the official provider of the global Capital Markets & Securities Analyst (CMSA)™Program Page - CMSAEnroll in CFI's CMSA® program and become a certified Capital Markets &Securities Analyst. Advance your career with our certification programs and courses. certification program, designed to help anyone become a world-class financial analyst. To keep advancing your career, the additional resources below will be useful:
- Bullish Engulfing CandlestickBullish Engulfing CandlestickA bullish engulfing candlestick shows a pattern of trading prices for a particular security, indicating a reversal in price trends. A
- Dark Cloud CoverDark Cloud CoverThe dark cloud cover refers to a candlestick pattern in technical analysis that is a bearish reversal signal. It is observed when a "down"
- Shooting StarShooting StarA shooting star is a specific technical analysis formation or pattern that occurs in candlestick charting. It is interpreted as a bearish reversal signal.
- Advanced Technical AnalysisAdvanced Technical AnalysisAdvanced technical analysis usually involves using either multiple technical indicators or a rather sophisticated (i.e., complex) indicator. "Sophisticated"
-
Exponential Moving Average (EMA): Definition & Trading Uses
The Exponential Moving Average (EMA) is a technical indicator used in trading practices that shows how the price of an asset or securitySecurityA security is a financial instrument, typically any fina
-

Kairi Relative Index (KRI): Definition & Technical Analysis
The Kairi Relative Index (KRI) is a type of oscillator indicator. It measures the deviation of an asset price from its daily average over a certain period of time, usually 10 to 20 days. The index was
invest
- Black-Scholes Model: Understanding Stock Option Pricing
- Double Top Pattern: Definition, Trading Signals & Analysis
- Understanding the Forward Curve: A Comprehensive Guide
- Fractal Indicator: Identify Trend Reversals in Trading
- Understanding the Heath-Jarrow-Morton (HJM) Interest Rate Model
- Heston Model: Understanding Volatility in Financial Options
- Understanding Market Support: What is 'Holding the Market'?
- Understanding Offering Price: A Guide for Investors
- Understanding Quoted Prices: A Comprehensive Guide
-
 Understanding Silver Price Fluctuations: Key Factors & Trends
Many factors affect the price of silver beyond its decorative value. For its applicability in jewelry, photography and electronics, silver has long been in demand as a precious metal and an i...
-
 Understanding Dead Cat bounces: A Stock Market Indicator
The dead cat bounce describes a financial phenomenon whereby a stock in a steady decline suddenly, and without a logical cause, gains value temporarily before continuing its downward trend. The term o...