Understanding Horizontal Lines in Technical Analysis & Geometry
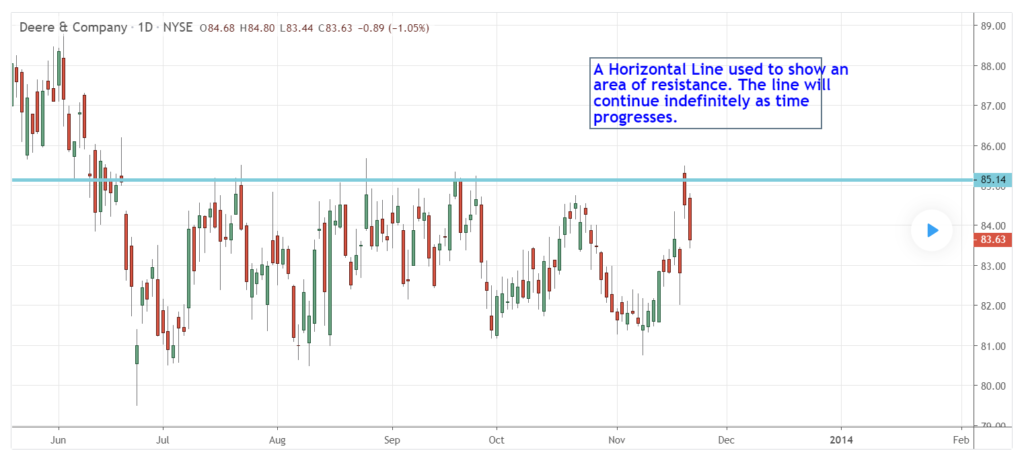
A horizontal line is a line drawn touching the support or resistance level on a price chart in technical analysis. Horizontal lines are commonly used to identify price breakouts and are deemed essential when analyzing trades.
In geometry analysis, a horizontal line is a straight line with a zero slope and perpendicular to the y-axis. It is also known as a constant function because all values on the line have the same y-values.
Summary
- A horizontal line is a line that is drawn on a price chart touching the support or resistance levels.
- Horizontal lines are used by traders to identify breakouts and to make trading decisions when the market poses fewer risks.
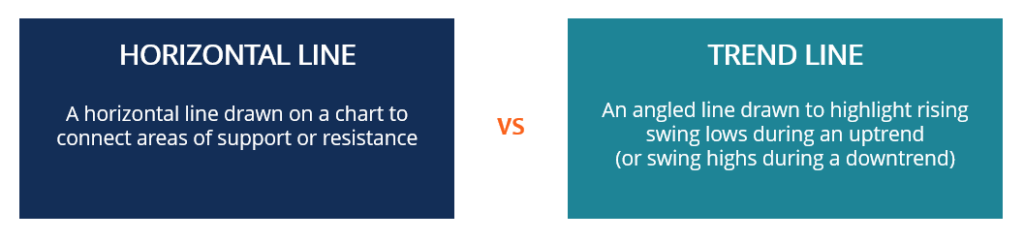
- Horizontal lines are different from trend lines in that the former is flat while the latter includes angles.
Understanding Horizontal Lines
Horizontal lines are used in technical analysisTechnical Analysis - A Beginner's GuideTechnical analysis is a form of investment valuation that analyses past prices to predict future price action. Technical analysts believe that the collective actions of all the participants in the market accurately reflect all relevant information, and therefore, continually assign a fair market value to securities. to highlight price action. They are primarily used to draw special attention to support or resistance levels. In this case, the support level means the point where the stock price stops falling due to demand concentration or buying interest. On the other hand, a resistance level occurs when demand concentration triggers a downward trend.
Horizontal lines are drawn by connecting the same swing points. When a horizontal line is drawn by connecting it to similar swing highs, it is called a horizontal resistance line. Similarly, horizontal support lines are drawn by connecting swing lows.
Analysts and traders use horizontal lines to predetermine when the market is favorable. A stock priceStock PriceThe term stock price refers to the current price that a share of stock is trading for on the market. Every publicly traded company, when its shares are is considered range-bound when trend lines are within the support and horizontal resistance lines. However, a further price decline can be indicated by the movement below the support horizontal line.
Similarly, movements above the resistance horizontal line signal higher prices. After reaching a horizontal resistance line, an increase in price means traders need to watch for a break-out above the resistance line. If a data sample is used to draw a horizontal line to highlight a series of lows and highs, a data point moving below or above the horizontal line will point to a decline and rise in the values of the x-axis.
Horizontal Line in Supply and Demand Curves
The vertical axis represents the price on a supply and demand curve, while the horizontal axis represents the quantity demanded. A perfectly horizontal line in a supply and demand curve shows that the quantity supplied or demanded demonstrates perfect elasticity or completely responds to price changes.
A change in the price above the market price results in quantity falling to zero. Perfect elasticity describes a market condition when consumers are unwilling to spend more than a specific price for goods or servicesProducts and ServicesA product is a tangible item that is put on the market for acquisition, attention, or consumption while a service is an intangible item, which arises from.
Horizontal Line vs. Trend Line
While both horizontal and trend lines can mean the same thing, there is a difference when trading them. The primary difference lies in the angle because their difference can also be found in trading shallow, regular, and steep lines. A horizontal line is particularly flat and horizontal, while a trend line is angled when drawn on a chart.
Trend lines may also be in different forms, based on their angles. For example, the steep trend line is angled more than 40 degrees, and the price movement exhibits a lot of momentum. A regular trend line is angled between 10 degrees and 40 degrees, and the price movement is well balanced and weaker. The shallow trend line is angled between 0 and 10 degrees, and the price movement is generally weak.
Limitations of Using a Horizontal Line
A horizontal line is subjectively drawn by traders at different prices. Stock prices may be subjected to opposing pressure when a horizontal line is drawn at highly important levels. It is therefore somewhat arbitrary and may not induce strong trading activity until a decisive move on prices occurs well below or above the horizontal line.
More Resources
CFI is the official provider of the global Capital Markets & Securities Analyst (CMSA)™Program Page - CMSAEnroll in CFI's CMSA® program and become a certified Capital Markets &Securities Analyst. Advance your career with our certification programs and courses. certification program, designed to help anyone become a world-class financial analyst. To keep advancing your career, the additional resources below will be useful:
- Advanced Technical AnalysisAdvanced Technical AnalysisAdvanced technical analysis usually involves using either multiple technical indicators or a rather sophisticated (i.e., complex) indicator. "Sophisticated"
- Horizontal ChannelHorizontal ChannelA horizontal channel is a trend line that connects the variable pivot highs and lows to highlight the price movements during a trading period
- Analysis of Financial StatementsAnalysis of Financial StatementsHow to perform Analysis of Financial Statements. This guide will teach you to perform financial statement analysis of the income statement,
- Moving AverageMoving AverageA moving average is a technical indicator that market analysts and investors may use to determine the direction of a trend. It sums up the data points
-
Advance-Decline Line: Understanding Market Momentum
The Advance-Decline (A/D) line is an indicator that is utilized by investors who want to measure the number of individual stocks. The A/D line can determine whether the stocks are participating in eit
-
Understanding Cryptocurrency: A Beginner's Guide to Digital Currency
Cryptocurrency is a kind of digital currency that is intended to act as a medium of exchange. Cryptocurrency has become popular in the last decade, in particular, with Bitcoin becoming the most widel
invest
- Horizontal Lines in Technical Analysis: Support & Resistance
- Bank Line of Credit (LOC): Definition & How It Works
- Horizontal Analysis: Understanding Financial Trends & Growth
- Understanding Horizontal Channels in Trading: A Comprehensive Guide
- Understanding Horizontal Spreads in Options Trading
- Understanding Resistance Lines in Technical Analysis
- Understanding Vertical Line Charts: A Beginner's Guide
- Horizontal Integration: Definition, Strategy & Benefits
- Horizontal Mergers: Definition, Benefits & Examples | [Your Company Name]
-
 Value Line Composite Index: Definition, History & Composition
The Value Line Composite Index was launched in 1982. It was the first market index to trade in the futuresFutures and ForwardsFuture and forward contracts (more commonly referred to as futures and for...
-
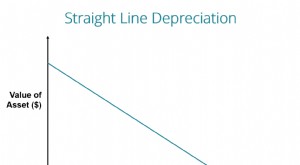 Straight-Line Depreciation: Definition, Calculation & Example
With the straight line depreciation method, the value of an asset is reduced uniformly over each period until it reaches its salvage valueSalvage ValueSalvage value is the estimated amount that a...