Understanding Vertical Line Charts: A Beginner's Guide
Vertical line charting is a graphical representation of the various price points of a given asset over a given period of time, which may vary from 15 minutes or five years. A continuous line is used to connect a series of data points, and the resulting line reflects the overall trends in price movement.
A vertical line chart is a very basic type of chart used in finance and is used to depict a security’s closing prices. A line chart can be used for any timeframe, but typically, technical tradersTechnical Analysis - A Beginner's GuideTechnical analysis is a form of investment valuation that analyses past prices to predict future price action. Technical analysts believe that the collective actions of all the participants in the market accurately reflect all relevant information, and therefore, continually assign a fair market value to securities. and market technicians record day-to-day price changes and chart them. The price trends of a security are thus tracked and used to forecast future price movements.
Summary
- Vertical line charting is a graphical representation of the various price points of a given asset over a given period of time.
- A continuous line is used to connect a series of data points, and the resulting line reflects the overall trends in price movement.
- Vertical charts convey a large amount of information in simple-to-plot and easy-to-read graphs and hence provide clear visual information about the market.
Understanding Vertical Line Charts
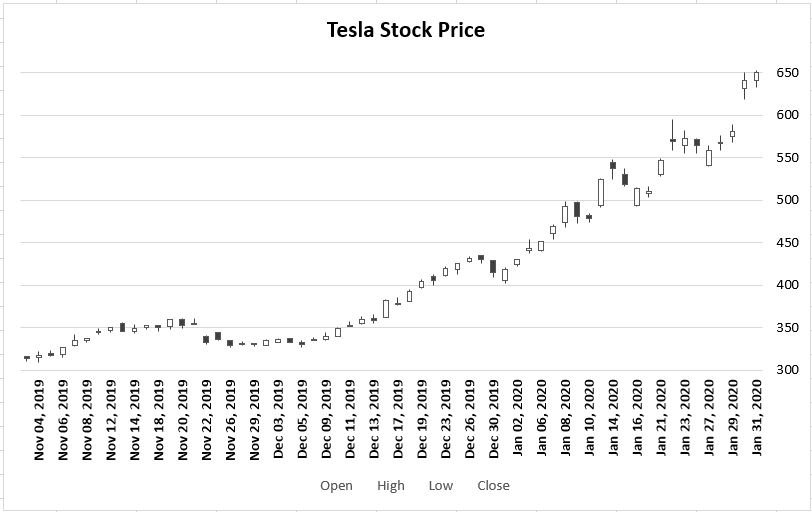
Vertical line charts are also called “close-only charts.” It is because only the closing prices of securities are plotted with dots. The security’s daily price action is summarized with a vertical bar. The security’s highest and lowest prices during the trading day are denoted by the top and bottom of the vertical line.
Advantages of Vertical Line Charting
- Vertical line charts are extremely simple to plot and easy to read since they provide clear visual information about the market.
- They also form the basis or starting point for more complex technical assessments, such as swing charts and Kagi charts. Thus, vertical line charting is an “initial assessment” tool.
- They convey a large amount of information to seasoned market practitioners. Vertical line charts also provide information about trend line, dominant support and resistance levelsResistance LineA Resistance Line, sometimes also known as a Speed Line, helps identify stock trends and levels of support and resistance. Resistance lines are technical indication tools used by equity analysts and investors to determine the price trend of a specific stock., and chart patterns. The patterns are bounding lines that represent the price movement of a security, which provides valuable insight to traders.
- They are important as price forecasting, or volatility measurement, is one of the most important parts of risk analysis. Any potential investor would want to look at the vertical line charts of a particular security to evaluate the amount of risk associated with investing in that security.
Disadvantages of Vertical Line Charting
- Vertical line charts do not give a complete assessment of trading prices Dow Jones Industrial Average (DJIA)The Dow Jones Industrial Average (DJIA), also referred to as "Dow Jones” or "the Dow", is one of the most widely-recognized stock market indices.since the highs and lows in prices are not accounted for. However, closing prices are still considered the most important indicators of the strength of a trading period.
Related Readings
CFI offers the Commercial Banking & Credit Analyst (CBCA)™Program Page - CBCAGet CFI's CBCA™ certification and become a Commercial Banking & Credit Analyst. Enroll and advance your career with our certification programs and courses. certification program for those looking to take their careers to the next level. To keep learning and developing your knowledge base, please explore the additional relevant resources below:
- Advanced Technical AnalysisAdvanced Technical AnalysisAdvanced technical analysis usually involves using either multiple technical indicators or a rather sophisticated (i.e., complex) indicator. "Sophisticated"
- How to Read Stock ChartsHow to Read Stock ChartsIf you’re going to actively trade stocks as a stock market investor, then you need to know how to read stock charts. Even traders who primarily use fundamental analysis to select stocks to invest in still often use technical analysis of stock price movement to determine specific buy and sell, stock charting
- Speed LinesSpeed Lines - Technical AnalysisSpeed lines are an analysis tool used to determine support and resistance levels. They are not intended to be used as a standalone technical indicator.
- Point & Figure (P&F) ChartPoint and Figure (P&F) ChartA Point and Figure (P&F) chart is made up of multiple columns of X's that represent increases in a stock's price and O's that represent decreases in price. A column of X's is always followed by a column of O's and vice-versa. The chart is composed of multiple boxes
-
Straight-Line Depreciation: Understanding the Basics
The straight line basis is a method used to determine an asset’s rate of reduction in value over its useful lifespan. Other common methods used to calculate depreciation expenses of fixed assets
-
Understanding Cryptocurrency: A Beginner's Guide to Digital Currency
Cryptocurrency is a kind of digital currency that is intended to act as a medium of exchange. Cryptocurrency has become popular in the last decade, in particular, with Bitcoin becoming the most widel
invest
- Bank Line of Credit (LOC): Definition & How It Works
- Advance-Decline Line: Understanding Market Sentiment & Trends
- Understanding Horizontal Lines in Technical Analysis & Geometry
- Understanding Resistance Lines in Technical Analysis
- Understanding Vertical Spreads: A Beginner's Guide
- Vertical Analysis: A Comprehensive Guide to Financial Statement Analysis
- Vertical Integration: Definition, Types & Benefits | [Your Company Name]
- Vertical Mergers: Definition, Examples & Impact on Business
- Personal Line of Credit (PLOC): Understanding and Benefits
-
 Understanding the MICR Line on Checks: A Comprehensive Guide
Magnetic ink character recognition, or MICR, is a technology used by banks to make the processing of paper checks easier. Magnetic ink character recognition, or MICR (pronounced MICK-er), is ...
-
 Understanding Below-the-Line Items in Financial Statements
Below the Line refers to items in a profit and loss Profit and Loss Statement (P&L)A profit and loss statement (P&L), or income statement or statement of operations, is a financial report...