Advance-Decline Line: Understanding Market Sentiment & Trends
The advance-decline line (ADL) is a technical indicator that plots the difference between the number of advancing stocks to declining stocks on a daily basis.
Understanding the Advance-Decline Line
The advance-decline line is used to show stock participation in a market risk or fall. Due to the number of capitalization-weighted indicesCapitalization-Weighted IndexThe Capitalization-Weighted Index (cap-weighted index, CWI) is a type of stock market index in which each component of the index is weighted relative to its total market capitalization. In a capitalization-weighted index, companies with larger market capitalization exert a greater impact on the index value. (such as the S&P 500, the DJIADow Jones Industrial Average (DJIA)The Dow Jones Industrial Average (DJIA), also referred to as "Dow Jones” or "the Dow", is one of the most widely-recognized stock market indices., and the NASDAQ Composite), stocks with a higher market capitalization would exert a disproportionate effect on the performance of an index. As such, the ADL provides an indication to investors regarding the participation of all stocks in an index in the direction of the market.
For example, if a capitalization-weighted stock index rose 3%, it would be important for investors to know whether (1) the rise in the index was due to a majority of stocks increasing, or (2) if the rise in the index was driven by the strong performance of a company with a large weight on the index. The ADL can be used to provide such information.
Formula for the Advance-Decline Line

Where:
- Advancing Stocks refers to the number of stocks that increased in value on a daily basis;
- Declining Stocks refers to the number of stocks that decreased in value on a daily basis; and
- Previous Net Advances refers to the net amount of advancing and declining stocks on a daily basis.
To fully understand how the advance-decline line is calculated, an example is illustrated below.
Practical Example
An investor is looking to create an advance-decline line for an index over a period of five days. The investor is given the following information:
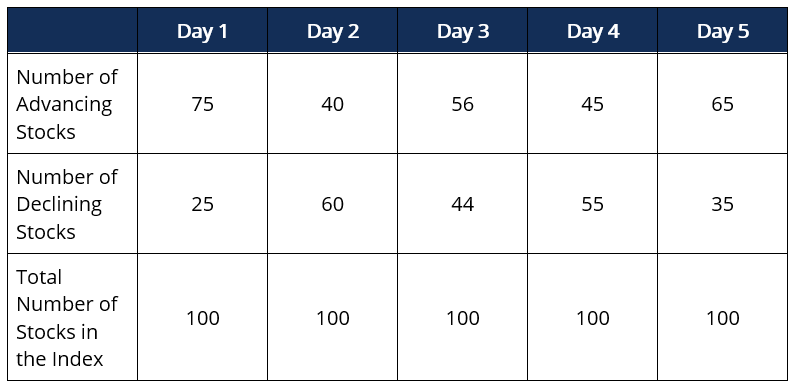
What is the ADL from Day 1 to Day 5?
ADL (Day 1) = 75 – 25 + 0 = 50
ADL (Day 2) = 40 – 60 + 50 = 30
ADL (Day 3) = 56 – 44 + 30 = 42
ADL (Day 4) = 45 – 55 + 42 = 32
ADL (Day 5) = 65 – 35 + 32 = 62
Interpreting the Advance-Decline Line
The advance-decline line is seldom used by itself. Instead, the ADL is plotted against its relevant index. Plotting the ADL against its relevant index can help investors confirm trendsMomentum IndicatorsMomentum indicators are tools utilized by traders to get a better understanding of the speed or rate at which the price of a security changes. Momentum and the likelihood of reversals. Following, we illustrate four interpretations of the concept:
1. Advance-Decline Line and Index Trending Upwards
A situation where the advance-decline line and index are both trending upwards is said to be bullish. The rise in the index is driven by the rise in the majority of stocks in the index.
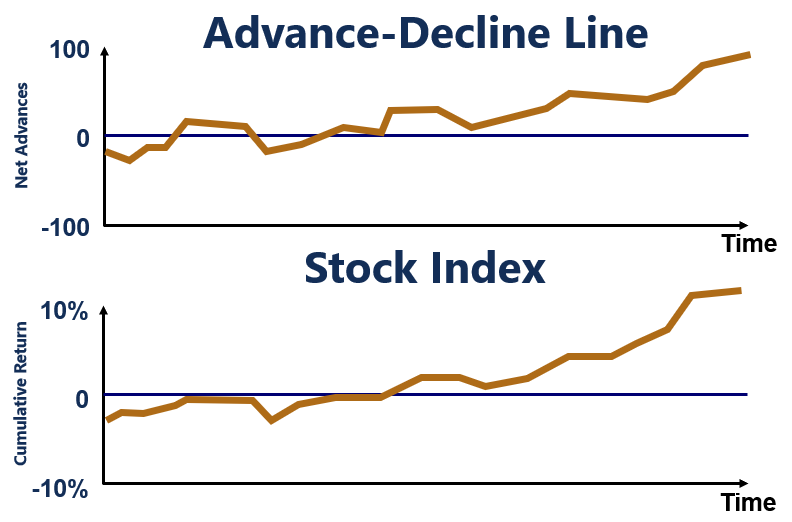
As such, investors tend to believe that the market will continue its uptrend in the near future.
2. Advance-Decline Line Trending Upwards and Index Trending Downwards
A situation where the advance-decline line and index are both trending downwards is said to be bearish. The decline in the index is driven by the decline in a majority of stocks in the index.
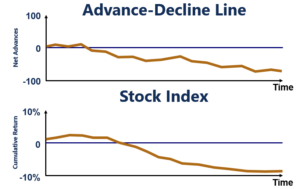
As such, investors tend to believe that the market will continue its downtrend in the near future.
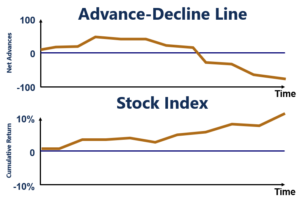
3. Advance-Decline Line Trending Upwards and Index Trending Downwards
A situation where the advance-decline line is trending upwards, but the index is trending downwards is said to be a bullish divergence. The decline in the index is driven by the decline in a minority of stocks in the index. Therefore, it indicates that sellers are losing their conviction.
As such, investors tend to believe that the market will show a reversal and trend upwards in the near future.
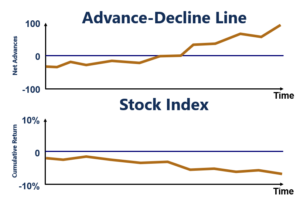
4. Advance-Decline Line Trending Downwards and Index Trending Upwards
A situation where the advance-decline line is trending downwards, but the index is trending upwards is said to be a bearish divergence. The increase in the index is driven by the increase in a minority of stocks in the index. Therefore, it indicates that buyers are losing their conviction.
As such, investors tend to believe that the market will show a reversal and trend downwards in the near future.
More Resources
CFI offers the Financial Modeling & Valuation Analyst (FMVA)™Become a Certified Financial Modeling & Valuation Analyst (FMVA)®CFI's Financial Modeling and Valuation Analyst (FMVA)® certification will help you gain the confidence you need in your finance career. Enroll today! certification program for those looking to take their careers to the next level. To keep learning and developing your knowledge base, please explore the additional relevant resources below:
- Advance Decline RatioAdvance Decline RatioThe advance decline ratio (ADR) is a technical indicator used to assess stock market sentiment. The ratio compares the number of stocks that increased in
- Price-Weighted IndexPrice-Weighted IndexA price-weighted index is a type of stock market index in which each component of the index is weighted according to its current share price. In price-weighted indices, companies with a high share price have a greater weight than those with a low share price.
- Standard & Poor’sS&P – Standard and Poor'sStandard & Poor’s is an American financial intelligence company that operates as a division of S&P Global. S&P is a market leader in the
- Technical Analysis – A Beginner’s GuideTechnical Analysis - A Beginner's GuideTechnical analysis is a form of investment valuation that analyses past prices to predict future price action. Technical analysts believe that the collective actions of all the participants in the market accurately reflect all relevant information, and therefore, continually assign a fair market value to securities.
-
Herrick Payoff Index: Understanding Derivative Market Trends
The Herrick Payoff Index is a forward-looking technical analysis tool used to identify trends in derivative markets. Using price, volume, and open interest, the index provides an overview of money flo
-
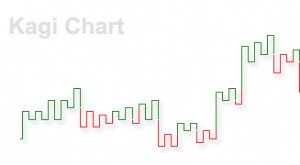
Kagi Chart Explained: A Clearer View of Price Action
The Kagi chart is a type of chart that shows the price movements of an asset. Different from a candlestick chart or other conventional types of charts, a Kagi chart does not contain a time axis, which
invest
- Advance-Decline Line: Understanding Market Momentum
- Arms Index (TRIN): Understanding Short-Term Market Sentiment
- DAX Index: Your Guide to Germany's Top 30 Companies
- EAFE Index: Understanding Developed Market Performance
- Nikkei Index: Understanding Japan's Top Stock Market Indicator
- Price-Weighted Index Explained: How It Works & Examples
- Value Line Composite Index: Definition, History & Composition
- Understanding the S&P 500: Top Holdings & Long-Term Performance
- Value Line Index: A Comprehensive Overview | Value Line
-
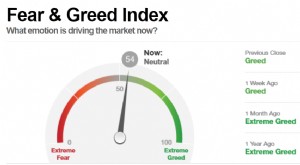 Fear & Greed Index: Understanding Investor Sentiment | CNN Business
The Fear and Greed Index, developed by CNNMoney, is used to gauge whether investors are too bullish or bearish on the stock market. The index ranges from 0 (extreme fear) to 100 (extreme greed). ...
-
 Hang Seng Index (HSI): A Comprehensive Guide to Hong Kong's Stock Market
The Hang Seng Index (HSI) is a stock market index in Hong Kong. It records and monitors the daily changes in stock prices of the 50 largest Hong Kong stock market companies. As the companies represent...