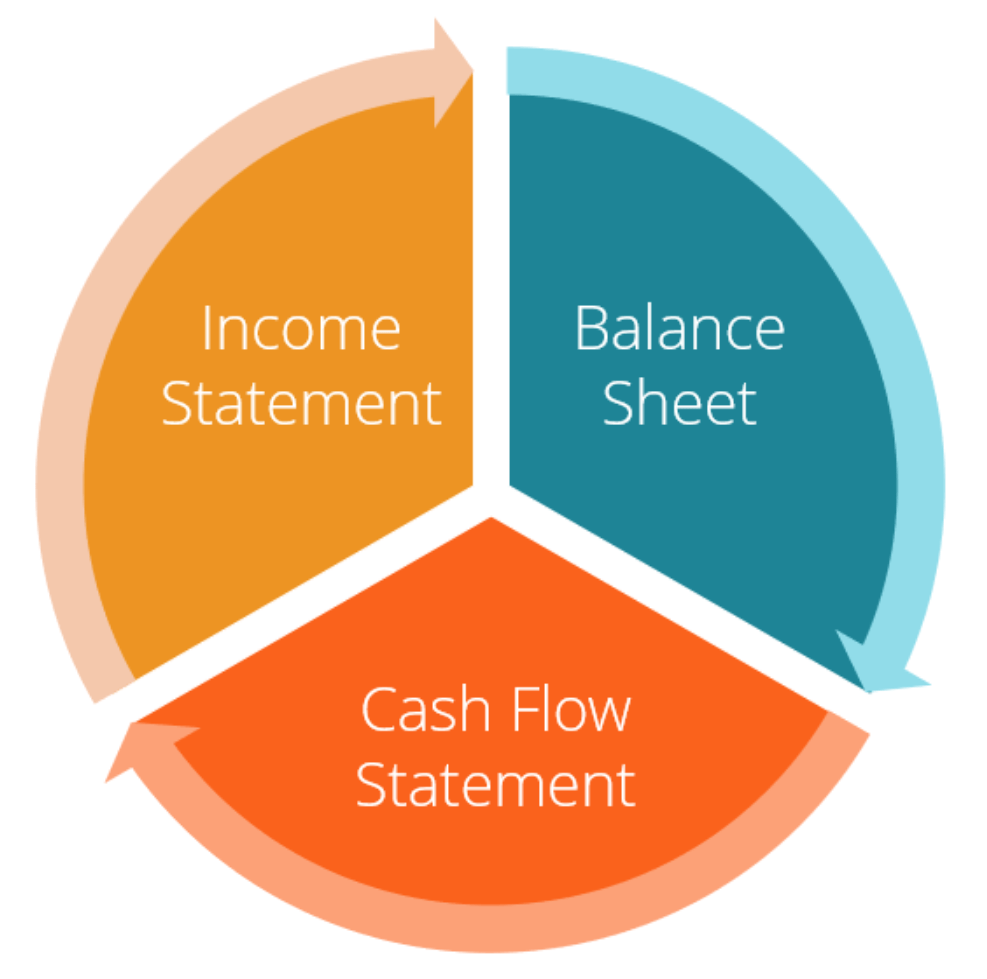
Understanding the Three Core Financial Statements
The three financial statements are: (1) the Income StatementIncome StatementThe Income Statement is one of a company's core financial statements that shows their profit and loss over a period of time. The profit or, (2) the Balance SheetBalance SheetThe balance sheet is one of the three fundamental financial statements. The financial statements are key to both financial modeling and accounting., and (3) the Cash Flow StatementStatement of Cash FlowsThe Statement of Cash Flows (also referred to as the cash flow statement) is one of the three key financial statements that report the cash. These three core statements are intricately linked to each other and this guide will explain how they all fit together. By following the steps below, you’ll be able to connect the three statements on your own.
Overview of the Three Financial Statements
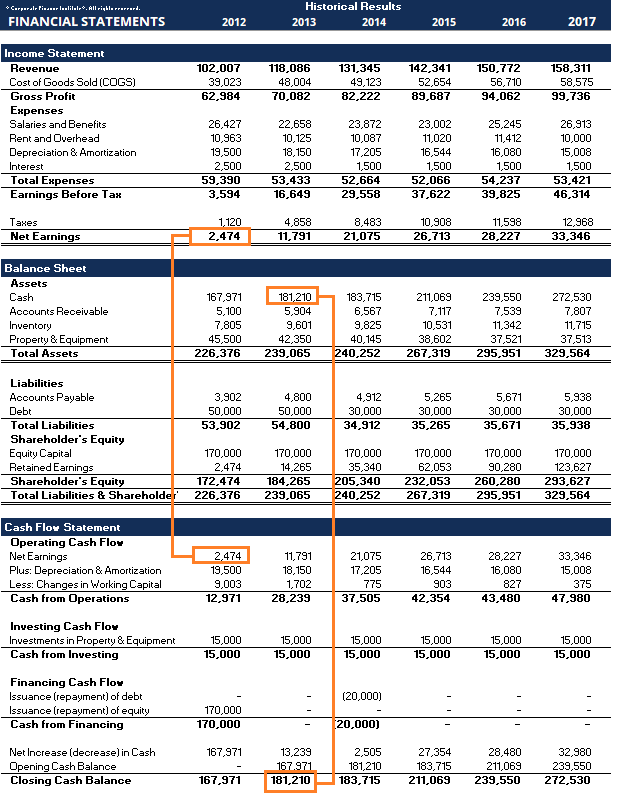
#1 Income statement
Often, the first place an investor or analyst will look is the income statement. The income statement shows the performance of the business throughout each period, displaying sales revenueSales RevenueSales revenue is the income received by a company from its sales of goods or the provision of services. In accounting, the terms "sales" and at the very top. The statement then deducts the cost of goods sold (COGSCost of Goods Manufactured (COGM)Cost of Goods Manufactured (COGM) is a term used in managerial accounting that refers to a schedule or statement that shows the total) to find gross profitGross ProfitGross profit is the direct profit left over after deducting the cost of goods sold, or cost of sales, from sales revenue. It's used to calculate the gross profit margin.. From there, the gross profit is affected by other operating expenses and income, depending on the nature of the business, to reach net incomeNet IncomeNet Income is a key line item, not only in the income statement, but in all three core financial statements. While it is arrived at through at the bottom – “the bottom line” for the business.
Key features:
- Shows the revenues and expenses of a business
- Expressed over a period of time (i.e., 1 year, 1 quarter, Year-to-Date, etc.)
- Uses accounting principles such as matching and accruals to represent figures (not presented on a cash basis)
- Used to assess profitability
#2 Balance sheet
The balance sheet displays the company’s assets, liabilities, and shareholders’ equityStockholders EquityStockholders Equity (also known as Shareholders Equity) is an account on a company's balance sheet that consists of share capital plus at a point in time. As commonly known, assets must equal liabilities plus equity. The asset section begins with cash and equivalentsCash EquivalentsCash and cash equivalents are the most liquid of all assets on the balance sheet. Cash equivalents include money market securities, banker's acceptances, which should equal the balance found at the end of the cash flow statement. The balance sheet then displays the changes in each major account from period to period. Net income from the income statement flows into the balance sheet as a change in retained earningsRetained EarningsThe Retained Earnings formula represents all accumulated net income netted by all dividends paid to shareholders. Retained Earnings are part (adjusted for payment of dividendsDividend vs Share Buyback/RepurchaseShareholders invest in publicly traded companies for capital appreciation and income. There are two main ways in which a company returns profits to its shareholders – Cash Dividends and Share Buybacks. The reasons behind the strategic decision on dividend vs share buyback differ from company to company).
Key features:
- Shows the financial position of a business
- Expressed as a “snapshot” or financial picture of the company at a specified point in time (i.e., as of December 31, 2017)
- Has three sections: assets, liabilities, and shareholders equity
- Assets = Liabilities + Shareholders Equity
#3 Cash flow statement
The cash flow statement then takes net income and adjusts it for any non-cash expenses. Then, using changes in the balance sheet, usage and receipt of cash is found. The cash flow statement displays the change in cash per period, as well as the beginning balance and ending balance of cash.
Key features:
- Shows the increases and decreases in cash
- Expressed over a period of time, an accounting period (i.e., 1 year, 1 quarter, Year-to-Date, etc.)
- Undoes all accounting principles to show pure cash movements
- Has three sections: cash from operations, cash used in investing, and cash from financing
- Shows the net change in the cash balance from start to end of the period
Summary Comparison
Income Statement Balance Sheet Cash Flow TimePeriod of timeA point in timePeriod of timePurposeProfitabilityFinancial positionCash movementsMeasuresRevenue, expenses, profitabilityAssets, liabilities, shareholders' equityIncreases and decreases in cashStarting PointRevenueCash balanceNet incomeEnding PointNet incomeRetained earningsCash balance
How are These 3 Core Statements Used in Financial Modeling?
As explained above, each of the three financial statements has an interplay of information. Financial modelsWhat is Financial ModelingFinancial modeling is performed in Excel to forecast a company's financial performance. Overview of what is financial modeling, how & why to build a model. use the trends in the relationship of information within these statements, as well as the trend between periods in historical data to forecast future performance.
The preparation and presentation of this information can become quite complicated. In general, however, the following steps are followed to create a financial model.
- Line items for each of the core statements are set up. It provides the overall format and skeleton that the financial model will follow
- Historical numbers are placed in each of the line items
- At this point, the creator of the model will often check to make sure that each of the core statements reconciles with data in the other. For example, the ending balance of cash calculated in the cash flow statement must equal the cash account in the balance sheet
- An assumptions section is prepared within the sheet to analyze the trend in each line item of the core statements between periods
- Assumptions from existing historical data are then used to create forecasted assumptions for the same line items
- The forecasted section of each core statement will use the forecasted assumptions to populate values for each line item. Since the analyst or user has analyzed past trends in creating the forecasted assumptions, the populated values should follow historical trends
- Supporting schedules are used to calculate more complex line items. For example, the debt scheduleDebt ScheduleA debt schedule lays out all of the debt a business has in a schedule based on its maturity and interest rate. In financial modeling, interest expense flows is used to calculate interest expense and the balance of debt items. The depreciation and amortization scheduleDepreciation ScheduleA depreciation schedule is required in financial modeling to link the three financial statements (income, balance sheet, cash flow) in Excel. is used to calculate depreciation expense and the balance of long-term fixed assets. These values will flow into the three main statements
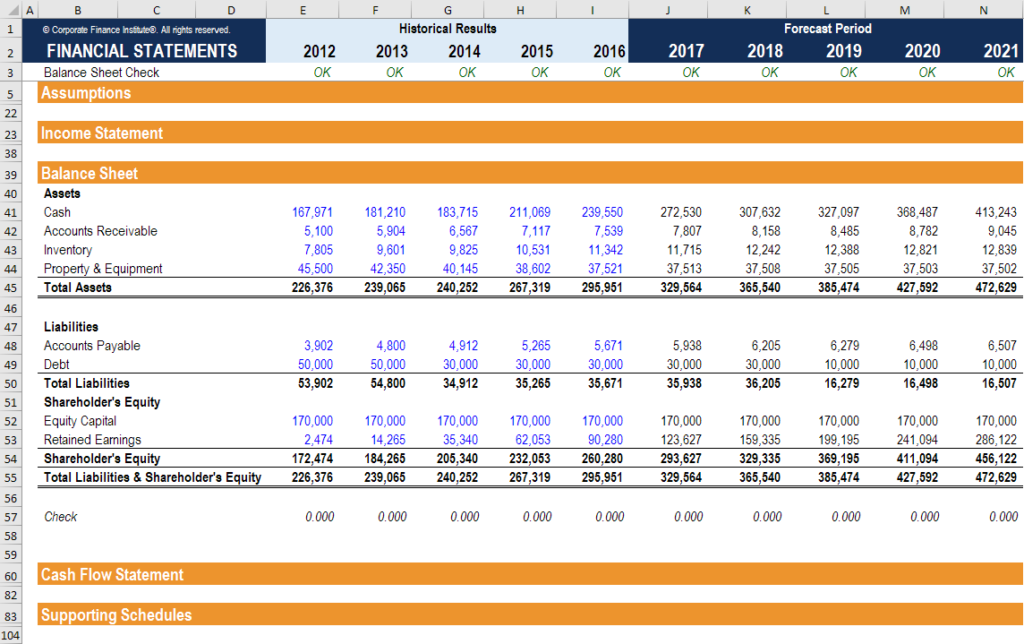
Screenshot from CFI’s financial modeling courses.
More Resources
We hope this has been a helpful overview for you of the 3 financial statements. CFI is the official provider of the global Financial Modeling & Valuation Analyst (FMVA)®Become a Certified Financial Modeling & Valuation Analyst (FMVA)®CFI's Financial Modeling and Valuation Analyst (FMVA)® certification will help you gain the confidence you need in your finance career. Enroll today! certification program, designed to help anyone become a world-class financial analyst.
Through financial modeling courses, training, and exercises, anyone in the world can become a great analyst. To continue learning, explore these additional CFI resources:
- How to Link the 3 StatementsHow the 3 Financial Statements are LinkedHow are the 3 financial statements linked together? We explain how to link the 3 financial statements together for financial modeling and
- What is Financial ModelingWhat is Financial ModelingFinancial modeling is performed in Excel to forecast a company's financial performance. Overview of what is financial modeling, how & why to build a model.
- Financial Modeling Best PracticesFree Financial Modeling GuideThis financial modeling guide covers Excel tips and best practices on assumptions, drivers, forecasting, linking the three statements, DCF analysis, more
- Interactive Career Map
-

Key Characteristics of a Successful Budget: Planning & Savings
Each successful budget takes into account the same basic categories or characteristics. A good budget makes sure you do not spend more than your annual income, and allows you to plan for upcoming expe
-
Petty Cash: Definition, Uses & Management for Businesses
Petty cash refers to a small amount of hard currency that a businesses will keep on hand to pay for miscellaneous and unexpected items, such as team lunches, birthday cakes, or office snacks. Pe
Accounting
- Harmonized Financial Statements: Pros, Cons, and Global Impact
- Income Statement Limitations: Understanding What Your Profit & Loss Report Doesn't Show
- Understanding Finance: A Comprehensive Overview
- Understanding Cash Equivalents: Definition & Examples
- Understanding Financial Statement Notes: A Comprehensive Guide
- Understanding Financial Statements: A Comprehensive Guide
- Understanding the Interrelationship of Financial Statements
- CPA vs. CFA: Understanding the Differences & Choosing the Right Finance Designation
- Mastering FP&A: A Guide to Understanding the Core Financial Statements
-
 Understanding Financial Assets: Definitions & Types
Financial assets refer to assets that arise from contractual agreements on future cash flowsCash Flow StatementA cash flow Statement contains information on how much cash a company generated an...
-
 FAFSA Income Limits: What You Need to Know for College Aid
Its no secret that the cost of attending college has increased rapidly over the past several years and decades. And while there are many scholarships and programs available to help with the cost of hi...