Understanding Efficiency Ratios: A Key to Business Performance
Efficiency ratios are metrics that are used in analyzing a company’s ability to effectively employ its resources, such as capital and assets, to produce income. The ratios serve as a comparison of expenses made to revenues generated, essentially reflecting what kind of return in revenue or profit a company can make from the amount it spends to operate its business.
The more efficiently a company is managed and operates, the more likely it is to generate maximum profitability for its owners and shareholders over the long term.
Financial analysts can examine a variety of efficiency ratios to make an all-encompassing assessment of a company’s overall operational efficiency, as different efficiency ratios focus on different areas of operation, such as how well a company manages its assets, cash flow, and inventory.
Efficiency Ratios in Financial Analysis
In essence, financial analysts consider efficiency ratios to be an important measure of the current and short-term performance of an organization.
Analysts typically screen through the company’s financial statements, such as the balance sheet and income statement, to aggregate the numbers for efficiency ratio calculations. For example, COGS, current assetsCurrent AssetsCurrent assets are all assets that a company expects to convert to cash within one year. They are commonly used to measure the liquidity of a, or current liabilitiesCurrent LiabilitiesCurrent liabilities are financial obligations of a business entity that are due and payable within a year. A company shows these on the figures are needed for some efficiency ratios.
After crunching the numbers, it is good to compare efficiency ratios with peer companies in the industry to get an insight into how the company performs relative to the competition.
Overall, there is a high correlation between efficiency ratios and profitability ratios. When companies efficiently allocate their resources, they become profitable. Therefore, if the efficiency ratios have been improved over time, this could indicate that the company has become more profitable.
Examples of Efficiency Ratios
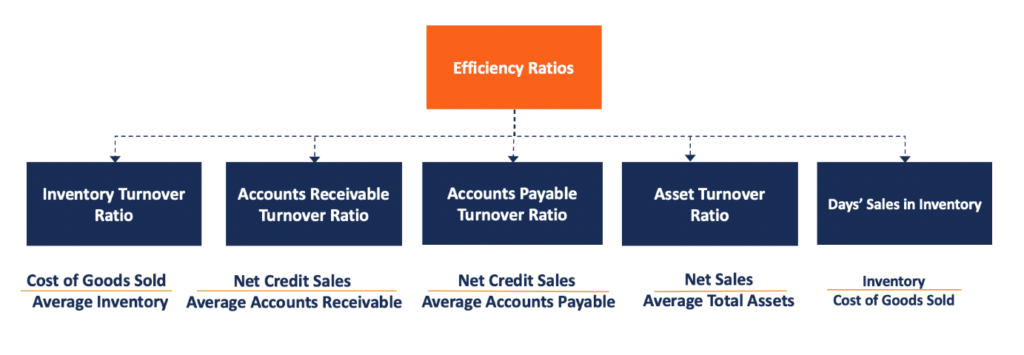
Among the most popular efficiency ratios are the following:
1. Inventory Turnover Ratio
The inventory turnover ratio is expressed as the number of times an enterprise sells out of its stock of goods within a given period of time. The ratio is calculated by taking the cost of goods soldCost of Goods Sold (COGS)Cost of Goods Sold (COGS) measures the “direct cost” incurred in the production of any goods or services. It includes material cost, direct over the average inventoryInventoryInventory is a current asset account found on the balance sheet, consisting of all raw materials, work-in-progress, and finished goods that a for a particular time period (e.g., 1 year).

2. Accounts Receivable Turnover Ratio

Where:
- Net Credit Sales are sales where the proceeds are collected at a later point in time. Net credit sales = Sales on credit – Sales returns – Sales allowances.
- Average Accounts Receivable is the sum of starting and ending accounts receivable balances over the time period (e.g., monthly or quarterly), divided by 2.
The accounts receivable ratio evaluates the efficiency of revenue collection. It measures the number of times a company collects its average accounts receivable over a given period.
3. Accounts Payable Turnover Ratio

Where:
- Net Credit Purchases = Cost of Goods Sold (COGS) + Ending Inventory balance – Starting Inventory balance for a specified period. However, this is the formula for purchases in general. Net credit purchases are only the purchases made on credit. Alternatively, since the number for net credit purchases is difficult to find, analysts often substitute COGS as the numerator instead.
- Average Accounts Payable is the sum of starting and ending accounts payable balances over a time period (e.g., monthly or quarterly), divided by 2. Both balances can be found on the company’s balance sheet.
The accounts payable turnover ratio represents the average number of times a company pays off its creditors during an accounting period. The ratio also serves as a measurement of short-term liquidity. A higher payable turnover ratio is favorable, as it enables the company to hold cash for a longer time. This, in turn, shrinks the working capital funding gap or working capital cycleWorking Capital CycleThe Working Capital Cycle for a business is the length of time it takes to convert the total net working capital (current assets less current.
Example
Company ABC reported annual purchases on credit of $128,457 and returns of $11,000 during the year ended December 31, 2018. Accounts payable at the beginning and end of the year were $12,555 and $26,121, respectively. The company wants to measure how many times it paid its creditors over the fiscal year.
According to the sample calculation, the company’s accounts payable turned over approximately 6.07 times during the year. It is a common practice to just round the ratio to 0 decimal points. In this case, we round it to 6.
4. Asset Turnover Ratio

Where:
- Net Sales = Sales minus Sales returns, Sales discounts, and Sales allowances
- Average Total Assets = (Total assets at the end of the period + Total assets at the beginning of the period) / 2.
Note: Analysts may use either average or end-of-period assets.
Imagine Company HBC reporting a value of the beginning total assets of $299,950 and ending total assets equal to $287,666. Over the same time period, the company generated sales of $350,555, with sales returns of $16,000.
In such a case, the asset turnover ratio for Company HBC is calculated as follows:

Thus, every dollar in total assets generates $1.1386 in sales.
In the end, efficiency ratios are useful for a company’s management in evaluating the operations of the business. Moreover, investors and lenders use the ratios when conducting financial analysis of companies in order to decide whether they represent a good investment or a creditworthy borrower.
Related Readings
CFI offers the Financial Modeling & Valuation Analyst (FMVA)™Become a Certified Financial Modeling & Valuation Analyst (FMVA)®CFI's Financial Modeling and Valuation Analyst (FMVA)® certification will help you gain the confidence you need in your finance career. Enroll today! certification program for those looking to take their careers to the next level. To keep learning and advancing your career, the following CFI resources will be helpful:
- Bank-Specific RatiosBank-Specific RatiosBank-specific ratios, such as net interest margin (NIM), provision for credit losses (PCL), and efficiency ratio are unique to the banking industry. Similar to companies in other sectors, banks have specific ratios to measure profitability and efficiency that are designed to suit their unique business operations.
- Leverage RatiosLeverage RatiosA leverage ratio indicates the level of debt incurred by a business entity against several other accounts in its balance sheet, income statement, or cash flow statement. Excel template
- Profitability RatiosProfitability RatiosProfitability ratios are financial metrics used by analysts and investors to measure and evaluate the ability of a company to generate income (profit) relative to revenue, balance sheet assets, operating costs, and shareholders' equity during a specific period of time. They show how well a company utilizes its assets to produce profit
- Financial Analysis Ratios GlossaryFinancial Analysis Ratios GlossaryGlossary of terms and definitions for common financial analysis ratios terms. It's important to have an understanding of these important terms.
-

Fixed Assets: Definition, Examples & Importance for Businesses
Fixed assets refer to long-term tangible assetsTangible AssetsTangible assets are assets with a physical form and that hold value. Examples include property, plant, and equipment. Tangible assets are
-

Understanding Fixed Costs: Definition, Examples & Importance
Fixed costs are a type of expense or cost that remains unchanged with an increase or decrease in the volume of goods or services sold. They are often time-related, such as interest or rents paid per m
finance
- Activity Ratios: A Comprehensive Guide to Operational Efficiency
- Understanding Key Bank Ratios: A Comprehensive Guide
- Understanding Corporate Finance Ratios: A Comprehensive Guide
- Credit Analysis Ratios: A Comprehensive Guide for Investors & Analysts
- Understanding Financial Ratios: A Comprehensive Guide
- Understanding Lending Ratios: A Guide for Credit Analysis
- Leverage Ratios: Understanding Financial Risk & Debt
- Understanding Profitability Ratios: A Comprehensive Guide
- Understanding Accounting Ratios: A Comprehensive Guide
-
 Fidelity Bonds: Protection Against Employee Dishonesty & Fraud
Fidelity bonds are designed to protect their policyholders from any loss that occurs as a result of harmful or deceitful actions by specifically indicated parties. In most cases, fidelity bonds are us...
-
 Financial Covenants: Definition, Types & Importance
Financial covenants are the promises or agreements entered into by a borrowing party that are financial in nature. An example of a financial covenant is when a borrowing company agrees to maintain (st...