Understanding Profitability Ratios: A Comprehensive Guide
Profitability ratios are financial metrics used by analysts and investors to measure and evaluate the ability of a company to generate income (profit) relative to revenue, balance sheet assetsIB Manual – Balance Sheet AssetsBalance sheet assets are listed as accounts or items that are ordered by liquidity. Liquidity is the ease with which a firm can convert an asset into cash. The most liquid asset is cash (the first item on the balance sheet), followed by short-term deposits and accounts receivable. This guide covers all balance sheet assets, examples, operating costs, and shareholders’ equityStockholders EquityStockholders Equity (also known as Shareholders Equity) is an account on a company's balance sheet that consists of share capital plus during a specific period of time. They show how well a company utilizes its assets to produce profit and value to shareholders.
A higher ratio or value is commonly sought-after by most companies, as this usually means the business is performing well by generating revenues, profits, and cash flow. The ratios are most useful when they are analyzed in comparison to similar companies or compared to previous periods. The most commonly used profitability ratios are examined below.
What are the Different Types of Profitability Ratios?
There are various profitability ratios that are used by companies to provide useful insights into the financial well-being and performance of the business.
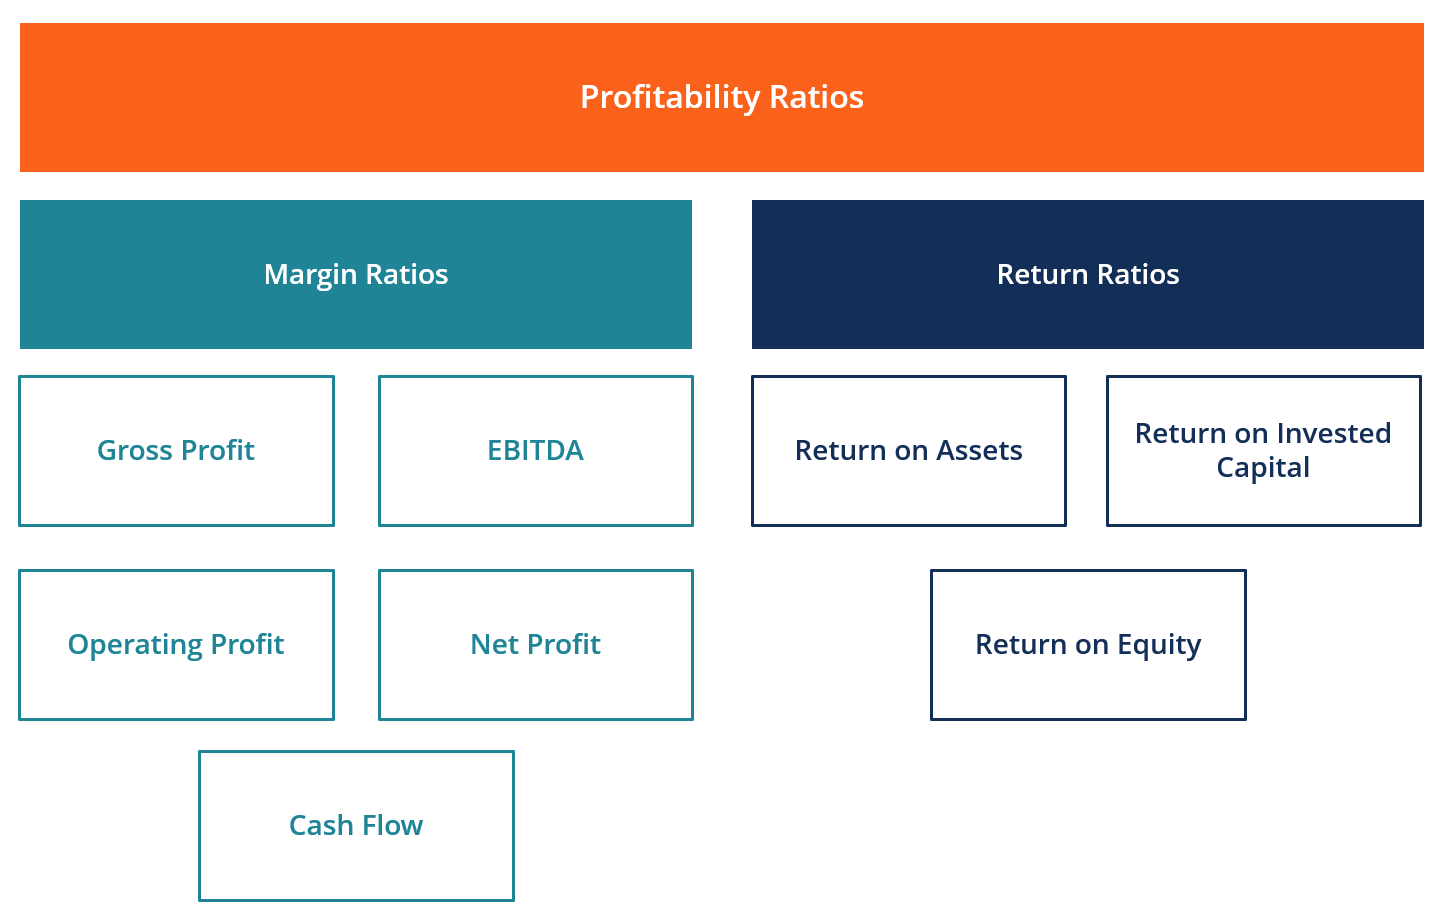
All of these ratios can be generalized into two categories, as follows:
A. Margin Ratios
Margin ratios represent the company’s ability to convert sales into profits at various degrees of measurement.
Examples are gross profit margin, operating profit marginOperating MarginOperating margin is equal to operating income divided by revenue. It is a profitability ratio measuring revenue after covering operating and, net profit marginNet Profit MarginNet Profit Margin (also known as "Profit Margin" or "Net Profit Margin Ratio") is a financial ratio used to calculate the percentage of profit a company produces from its total revenue. It measures the amount of net profit a company obtains per dollar of revenue gained., cash flow margin, EBITEBIT GuideEBIT stands for Earnings Before Interest and Taxes and is one of the last subtotals in the income statement before net income. EBIT is also sometimes referred to as operating income and is called this because it's found by deducting all operating expenses (production and non-production costs) from sales revenue., EBITDAEBITDAEBITDA or Earnings Before Interest, Tax, Depreciation, Amortization is a company's profits before any of these net deductions are made. EBITDA focuses on the operating decisions of a business because it looks at the business’ profitability from core operations before the impact of capital structure. Formula, examples, EBITDAR, NOPATNOPATNOPAT stands for Net Operating Profit After Tax and represents a company's theoretical income from operations., operating expense ratio, and overhead ratio.
B. Return Ratios
Return ratios represent the company’s ability to generate returns to its shareholders.
Examples include return on assets, return on equity, cash return on assets, return on debt, return on retained earnings, return on revenue, risk-adjusted return, return on invested capital, and return on capital employed.
What are the Most Commonly Used Profitability Ratios and Their Significance?
Most companies refer to profitability ratios when analyzing business productivity, by comparing income to sales, assets, and equity.
Six of the most frequently used profitability ratios are:
#1 Gross Profit Margin
Gross profit marginNet Profit MarginNet Profit Margin (also known as "Profit Margin" or "Net Profit Margin Ratio") is a financial ratio used to calculate the percentage of profit a company produces from its total revenue. It measures the amount of net profit a company obtains per dollar of revenue gained. – compares gross profit to sales revenue. This shows how much a business is earning, taking into account the needed costs to produce its goods and services. A high gross profit margin ratio reflects a higher efficiency of core operations, meaning it can still cover operating expenses, fixed costs, dividends, and depreciation, while also providing net earnings to the business. On the other hand, a low profit margin indicates a high cost of goods sold, which can be attributed to adverse purchasing policies, low selling prices, low sales, stiff market competition, or wrong sales promotion policies.
Learn more about these ratios in CFI’s financial analysis courses.
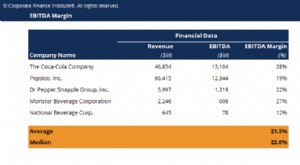
#2 EBITDA Margin
EBITDAEBITDAEBITDA or Earnings Before Interest, Tax, Depreciation, Amortization is a company's profits before any of these net deductions are made. EBITDA focuses on the operating decisions of a business because it looks at the business’ profitability from core operations before the impact of capital structure. Formula, examples stands for Earnings Before Interest, Taxes, Depreciation, and Amortization. It represents the profitability of a company before taking into account non-operating items like interest and taxes, as well as non-cash items like depreciation and amortization. The benefit of analyzing a company’s EBITDA marginEBITDA MarginEBITDA margin = EBITDA / Revenue. It is a profitability ratio that measures earnings a company is generating before taxes, interest, depreciation, and amortization. This guide has examples and a downloadable template is that it is easy to compare it to other companies since it excludes expenses that may be volatile or somewhat discretionary. The downside of EBTIDA margin is that it can be very different from net profit and actual cash flow generation, which are better indicators of company performance. EBITDA is widely used in many valuation methodsValuation MethodsWhen valuing a company as a going concern there are three main valuation methods used: DCF analysis, comparable companies, and precedent transactions.
#3 Operating Profit Margin
Operating profit marginOperating MarginOperating margin is equal to operating income divided by revenue. It is a profitability ratio measuring revenue after covering operating and – looks at earnings as a percentage of sales before interest expense and income taxes are deduced. Companies with high operating profit margins are generally more well-equipped to pay for fixed costs and interest on obligations, have better chances to survive an economic slowdown, and are more capable of offering lower prices than their competitors that have a lower profit margin. Operating profit margin is frequently used to assess the strength of a company’s management since good management can substantially improve the profitability of a company by managing its operating costs.
#4 Net Profit Margin
Net profit marginNet Profit MarginNet Profit Margin (also known as "Profit Margin" or "Net Profit Margin Ratio") is a financial ratio used to calculate the percentage of profit a company produces from its total revenue. It measures the amount of net profit a company obtains per dollar of revenue gained. is the bottom line. It looks at a company’s net income and divides it into total revenue. It provides the final picture of how profitable a company is after all expenses, including interest and taxes, have been taken into account. A reason to use the net profit margin as a measure of profitability is that it takes everything into account. A drawback of this metric is that it includes a lot of “noise” such as one-time expenses and gains, which makes it harder to compare a company’s performance with its competitors.
#5 Cash Flow Margin
Cash flow margin – expresses the relationship between cash flows from operating activitiesOperating Cash FlowOperating Cash Flow (OCF) is the amount of cash generated by the regular operating activities of a business in a specific time period. and sales generated by the business. It measures the ability of the company to convert sales into cash. The higher the percentage of cash flow, the more cash available from sales to pay for suppliers, dividends, utilities, and service debt, as well as to purchase capital assets. Negative cash flow, however, means that even if the business is generating sales or profits, it may still be losing money. In the instance of a company with inadequate cash flow, the company may opt to borrow funds or to raise money through investors in order to keep operations going.
Managing cash flowCash Conversion CycleThe Cash Conversion Cycle (CCC) is a metric that shows the amount of time it takes a company to convert its investments in inventory to cash. The cash conversion cycle formula measures the amount of time, in days, it takes for a company to turn its resource inputs into cash. Formula is critical to a company’s success because always having adequate cash flow both minimizes expenses (e.g., avoid late payment fees and extra interest expense) and enables a company to take advantage of any extra profit or growth opportunities that may arise (e.g. the opportunity to purchase at a substantial discount the inventory of a competitor who goes out of business).
#6 Return on Assets
Return on assets (ROA)Return on Assets & ROA FormulaROA Formula. Return on Assets (ROA) is a type of return on investment (ROI) metric that measures the profitability of a business in relation to its total assets., as the name suggests, shows the percentage of net earnings relative to the company’s total assets. The ROA ratio specifically reveals how much after-tax profit a company generates for every one dollar of assets it holds. It also measures the asset intensity of a business. The lower the profit per dollar of assets, the more asset-intensive a company is considered to be. Highly asset-intensive companies require big investments to purchase machinery and equipment in order to generate income. Examples of industries that are typically very asset-intensive include telecommunications services, car manufacturers, and railroads. Examples of less asset-intensive companies are advertising agencies and software companies.
Learn more about these ratios in CFI’s financial analysis courses.
#7 Return on Equity
Return on equity (ROE)Return on Equity (ROE)Return on Equity (ROE) is a measure of a company’s profitability that takes a company’s annual return (net income) divided by the value of its total shareholders' equity (i.e. 12%). ROE combines the income statement and the balance sheet as the net income or profit is compared to the shareholders’ equity. – expresses the percentage of net income relative to stockholders’ equity, or the rate of return on the money that equity investors have put into the business. The ROE ratio is one that is particularly watched by stock analysts and investors. A favorably high ROE ratio is often cited as a reason to purchase a company’s stock. Companies with a high return on equity are usually more capable of generating cash internally, and therefore less dependent on debt financing.
#8 Return on Invested Capital
Return on invested capital (ROIC)Return on Invested CapitalReturn on Invested Capital - ROIC - is a profitability or performance measure of the return earned by those who provide capital, namely, the firm’s bondholders and stockholders. A company's ROIC is often compared to its WACC to determine whether the company is creating or destroying value. is a measure of return generated by all providers of capital, including both bondholdersBond IssuersThere are different types of bond issuers. These bond issuers create bonds to borrow funds from bondholders, to be repaid at maturity. and shareholdersStockholders EquityStockholders Equity (also known as Shareholders Equity) is an account on a company's balance sheet that consists of share capital plus. It is similar to the ROE ratio, but more all-encompassing in its scope since it includes returns generated from capital supplied by bondholders.
The simplified ROIC formula can be calculated as: EBIT x (1 – tax rate) / (value of debt + value of + equity). EBIT is used because it represents income generated before subtracting interest expenses, and therefore represents earnings that are available to all investors, not just to shareholders.
Video Explanation of Profitability Ratios and ROE
Below is a short video that explains how profitability ratios such as net profit margin are impacted by various levers in a company’s financial statements.
Financial Modeling (going beyond profitability ratios)
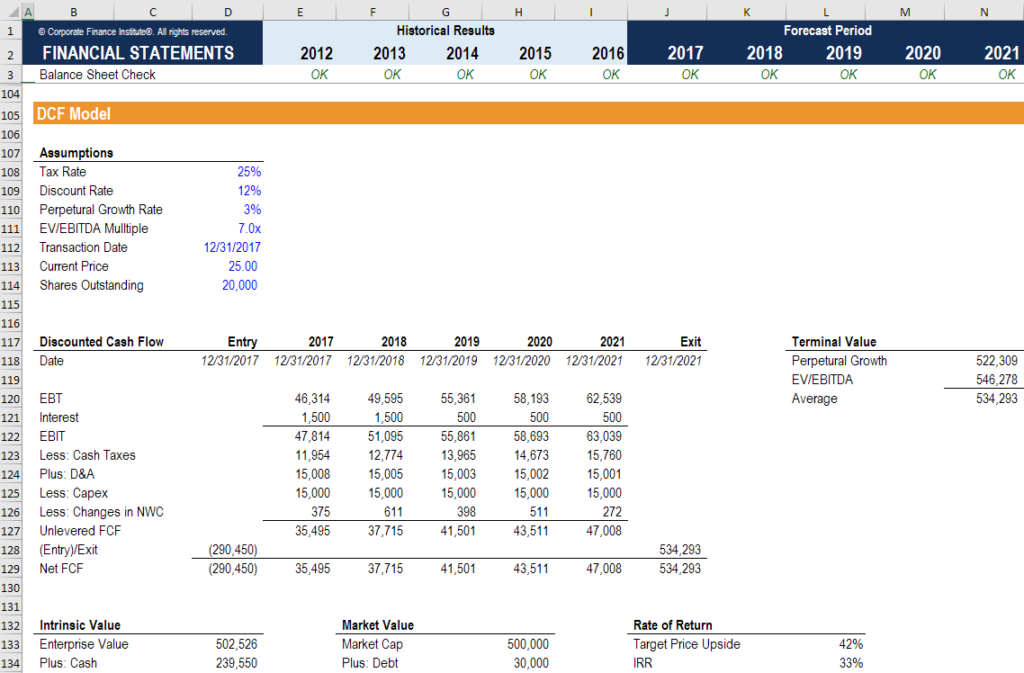
While profitability ratios are a great place to start when performing financial analysis, their main shortcoming is that none of them take the whole picture into account. A more comprehensive way to incorporate all the significant factors that impact a company’s financial health and profitability is to build a DCF modelDCF Model Training Free GuideA DCF model is a specific type of financial model used to value a business. The model is simply a forecast of a company’s unlevered free cash flow that includes 3-5 years of historical results, a 5-year forecast, a terminal value, and that provides a Net Present Value (NPV)NPV FormulaA guide to the NPV formula in Excel when performing financial analysis. It's important to understand exactly how the NPV formula works in Excel and the math behind it. NPV = F / [ (1 + r)^n ] where, PV = Present Value, F = Future payment (cash flow), r = Discount rate, n = the number of periods in the future of the business.
In the screenshot below, you can see how many of the profitability ratios listed above (such as EBIT, NOPAT, and Cash Flow) are all factors of a DCF analysis. The goal of a financial analyst is to incorporate as much information and detail about the company as reasonably possible into the Excel modelExcel & Financial Model TemplatesDownload free financial model templates - CFI's spreadsheet library includes a 3 statement financial model template, DCF model, debt schedule, depreciation schedule, capital expenditures, interest, budgets, expenses, forecasting, charts, graphs, timetables, valuation, comparable company analysis, more Excel templates.
To learn more, check out CFI’s financial modeling courses online!
Additional Resources
Thank you for reading this guide to analyzing and calculating profitability ratios. CFI is the official global provider of the Financial Modeling and Valuation Analyst designationBecome a Certified Financial Modeling & Valuation Analyst (FMVA)®CFI's Financial Modeling and Valuation Analyst (FMVA)® certification will help you gain the confidence you need in your finance career. Enroll today! and is on a mission to help you Advance Your Career. With that goal in mind, these additional CFI resources will help you become a world-class financial analyst:
- Free accounting & finance courses
- Free Excel crash course
- How to value a private companyPrivate Company Valuation3 techniques for Private Company Valuation - learn how to value a business even if it's private and with limited information. This guide provides examples including comparable company analysis, discounted cash flow analysis, and the first Chicago method. Learn how professionals value a business
- Financial modeling guideFree Financial Modeling GuideThis financial modeling guide covers Excel tips and best practices on assumptions, drivers, forecasting, linking the three statements, DCF analysis, more
-
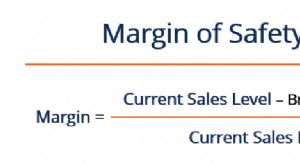
Margin of Safety: Definition, Calculation & Importance
The margin of safety is the difference between the amount of expected profitability and the break-even point. The margin of safety formula is equal to current sales minus the breakeven point, divided
-
Profit vs. Cash Flow: Understanding the Key Difference
Understanding the difference between profit vs cash is very important in the finance industry. Profit is defined as revenue less all the expenses of a company in a certain period, while cash flow is c
finance
- Understanding Gross Profit Margin: Definition & Calculation
- Activity Ratios: A Comprehensive Guide to Operational Efficiency
- Credit Analysis Ratios: A Comprehensive Guide for Investors & Analysts
- Understanding Efficiency Ratios: A Key to Business Performance
- Net Profit Margin: Definition, Calculation & Importance
- Operating Profit Margin: Definition & Calculation | [Your Company Name]
- Understanding Accounting Ratios: A Comprehensive Guide
- Operating Margin: Definition, Calculation & Importance
- Profit Margin Explained: Types & How to Calculate
-
 Margin Trading: Understanding Requirements & Risks
Margin trading is a special form of trading that involves borrowing money from a stockbroker to purchase shares. The investor then repays the money plus an interest fee at a later date. The shares ser...
-
 EBITDA Margin: Definition, Calculation & Importance
EBITDA margin is a profitability ratio that measures how much in earnings a company is generating before interest, taxes, depreciation, and amortization, as a percentage of revenue. EBITDA Margin = EB...