Understanding Quarter-over-Quarter (QoQ) Growth: A Comprehensive Guide
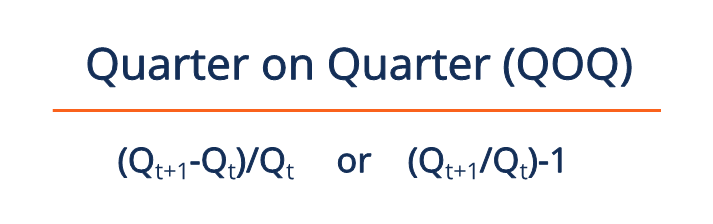
Quarter on quarter (QOQ) is the rate of change between quarterly fiscal data. It is a commonly used metric in determining a company’s quarterly growth or, alternatively, used broadly to evaluate macroeconomic performance (such as GDPGross Domestic Product (GDP)Gross domestic product (GDP) is a standard measure of a country’s economic health and an indicator of its standard of living. Also, GDP can be used to compare the productivity levels between different countries.). QOQ is used synonymously with quarter over quarter (Q/Q).
Summary
- Quarter on quarter (QQQ) is the rate of change between quarterly data. It is commonly used to determine a company’s performance or economic growth/decline. It also allows for investors to compare across different investments of various sizes.
- Comparables must be around the same start time, or results may be skewed by seasonality or specific events.
- Other time frames include monthly and yearly, which use metrics such as month-over-month (MOM) and year-over-year (YOY).
Understanding Quarter on Quarter (QOQ)
Quarter on quarter is a popular measurement largely because important public company reports are often issued quarterly – such as the SEC Form 10-QForm 10-QForm 10-Q is a report – required by the Securities and Exchange Commission (SEC) – that must be filed quarterly by all public companies. The form is similar to Form 10-K; however, it typically contains fewer details and the financial statements included are typically unaudited. Three quarterly Forms 10-Q must be filed each year. QOQ can be used by businesses to track their performance relative to their goals.
Furthermore, such measurement on historical data allows investors and policymakers to readjust their decisions and gain a perspective of future performance. By calculating change, it also allows investors to compare across different investments of various sizes.
Quarter on Quarter Examples
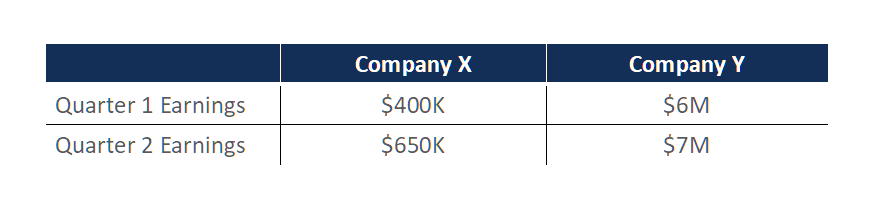
Consider the scenario above comparing quarterly returns between two companies. Company X is a newly founded small-cap companySmall CapsSmall caps refer to companies with a market capitalization generally ranging from $300 million to $2 billion. The market capitalization, while Company Y is a mature large-cap company. Due to the large differences between the two companies, it would be impractical to directly compare total earnings.
An appropriate approach to comparing the two companies is by calculating the quarter-on-quarter earnings growth. Company X’s QOQ earnings growth is (650-400)/400 = 0.625 or 62.5%. Company Y’s QOQ earnings growth is (7-6)/6 = 0.167 or 16.7%.
From the QOQ figures, we can gather that Company X experienced spectacular growth, and as an investor, we may be more inclined to invest in Company X (with the consideration of other metrics as well).
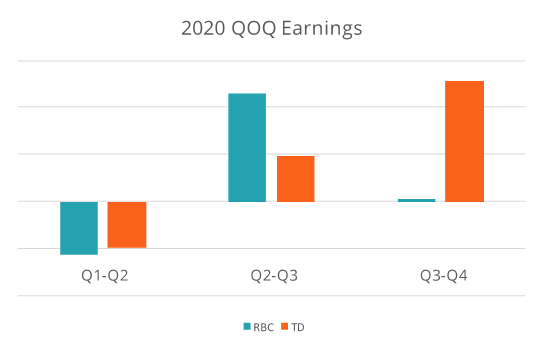
Quarter on quarter is often observed over several quarters to determine longer trends. In the chart above, QOQ results are plotted for the Royal Bank of Canada (RBC) and Toronto Dominion (TD) over four quarters of 2020.
As observed, both companies suffer a sharp decline in earnings between Q1-Q2. From Q2-Q3, both companies experienced positive growth, with RBC’s growth more than doubled TD’s. In the last segment from Q3-Q4, RBC experienced minimal earnings growth while TD accomplished an impressive upsurge.
One caveat is that the quarters of the comparables must be around the same start date to be accurate. Otherwise, our results can be skewed by seasonality or specific events.
For example, if we compare the QOQ of RBC from Q3 2019 – Q4 2019 and TD from Q4 2019 – Q1 2020, our results would be very distorted because TD’s data would be negatively impacted by the COVID-19 pandemic in early 2020.
Other Time Frames
The other two widely used time frames are monthly and yearly. Among the major economic indicators are Consumer Price Index (CPI)Consumer Price Index (CPI)The Consumer Price Index (CPI) is a measure of the aggregate price level in an economy. The CPI consists of a bundle of commonly purchased and inflation, which are reported on a monthly basis. Perhaps, the most important report for investors is the SEC Form 10-K – a comprehensive audited report that is released annually. For such information, metrics such as month-over-month (MOM) and year-over-year (YOY) would be applicable.
There are a few subtle differences between the time frames. Shorter time frames, such as monthly, are valuable for analyzing data that are driven by short-term factors. Short-term data and metrics will also be more volatile. Longer time frames like yearly are best suited for data-driven by long-term factors. Long-term metrics are less susceptible to fluctuations because it smooths out short-term deviations.
For example, conducting YOY over two years would be similar to conducting QOQ over eight quarters or MOM over 24 months. Longer time frames provide a holistic overview of performance, while shorter time frames demonstrate a better representation of the effects of events and seasonality.
Learn More
CFI offers the Capital Markets & Securities Analyst (CMSA)®Program Page - CMSAEnroll in CFI's CMSA® program and become a certified Capital Markets &Securities Analyst. Advance your career with our certification programs and courses. certification program for those looking to take their careers to the next level. To keep learning and advance your career, the following resources will be helpful:
- Quarterly Revenue GrowthQuarterly Revenue GrowthQuarterly revenue growth refers to an increase in the company's sales from one quarter to the next. The sales figure for the current quarter
- SEC FilingsSEC FilingsSEC filings are financial statements, periodic reports, and other formal documents that public companies, broker-dealers, and insiders are required to submit to the U.S. Securities and Exchange Commission (SEC). The SEC was created in the 1930s with an aim to curb stock manipulation and fraud
- YOY (Year on Year)YoY (Year over Year)YoY stands for Year over Year and is a type of financial analysis used for comparing time series data. It is useful for measuring growth and detecting trends.
- SeasonalitySeasonalitySeasonality is a characteristic of data where there exist predictive fluctuations in a data set depending on the time of year. Many different
-

Advertising Budget: Definition, Planning & Best Practices
An advertising budget is a company’s allocation of promotional expenditures over a specified time period. It is a measure of a company’s planned expenditure on accomplishing marketing obje
-

Amalgamation Explained: Mergers & Corporate Combinations
In corporate financeCorporate Finance OverviewCorporate finance deals with the capital structure of a corporation, including its funding and the actions that management takes to increase the value of,
finance
- Acquirer Definition: Understanding Corporate Acquisitions
- Understanding Clawbacks: Protecting Stakeholders from Failed Performance
- Understanding Financial Gearing: Debt & Leverage Explained
- Leverage in Finance: Strategies, Types & Risks
- Parent Company Explained: Definition, Control & Examples
- Understanding Stocks: A Beginner's Guide to Share Ownership
- Understanding Net-Net: A Financial Health Indicator
- EBITA Explained: Understanding Earnings Before Interest, Taxes, and Amortization
- Understanding Expenditures: Definition and Types
-
 Understanding Acquisition Cost: Definitions & Applications
Acquisition cost is the cost of purchasing an asset. It is generally used in three different contexts in business, which include the following:Mergers and acquisitionsFixed assetsCustomer acquisition&...
-
 Streamlining Processes: Definition, Benefits & Techniques
Streamlining refers to the improvement of the efficiency of a certain process within an organization. It can be done by automationExcel vs Automation in Financial ModelingBefore we discuss Excel vs au...