Volume Analysis: A Comprehensive Guide for Traders & Investors
Volume analysis refers to the examination of the total number of securities transacted within a given time period. They can be shares or contracts of any given security. Technical analysts consider trading volumeVolume of TradeVolume of trade, also known as trading volume, refers to the quantity of shares or contracts that belong to a given security traded on a daily basis as one of the major indicators of the probability of success of a particular trading decision. Investors can arrive at the degree of impact of the changes in the price of a security on the return by analyzing trends associated with volume, as well as price movements.

Volume, simply put, is the number of contracts that exchange hands within a given time period, which is usually on a daily basis. Any analyst who follows securities in financial markets typically uses volume analysis.
Financial analystsFinancial Analysts - What Do They Do must be able to understand and discern volume trends, especially because the statistics about the trading volume of an entire market, as opposed to a single holding’s trading volume, can signify different things about the market.
Summary
- Volume analysis refers to the examination of the total number of securities transacted within a given time period.
- Trading volume can be analyzed to infer many trends in financial markets, such as liquidity, price reversal, trend confirmation, bullish signs, etc.
- For investors who consider volume while making trading decisions, certain indicators are available, such as PVI and NVI.
What Does a Change in Volume Signify?
Volume analysis can be analyzed to infer many trends in financial markets. Some of the trends include the following:
1. Trend confirmation
Trend confirmation is an important function performed by volume data. A rising volume usually implies that the market is rising. In order for buyers to keep pushing prices higher, they need to show high expectations. Increasing numbers of volume data can lead to such an increase in the enthusiasm of buyers.
A price jump in isolation cannot be considered a strong enough signal of investor confidence. However, when coupled with significant trading volumes, it sends a strong signal that investor sentiment is optimistic. An increase in prices coupled with decreasing trading volume can warn of a lack of investors’ interest in the markets, which can lead to a reversal of booms.
2. Bullish signs
Volume can be used in order to identify bullishBullish and BearishProfessionals in corporate finance regularly refer to markets as being bullish and bearish based on positive or negative price movements. A bear market is typically considered to exist when there has been a price decline of 20% or more from the peak, and a bull market is considered to be a 20% recovery from a market bottom. signs in the market. For example, consider a situation where prices decline, but volume increases. Consequent to the occurrence, prices increase and then fall again.
If the decrease in prices the second time does not fall lower than the first low, the volume at the time of the second decline gets diminished. It is perceived as a sign that markets are bullish.
3. Price reversals
Consider a situation where the price of a security has moved in one direction for a long period of time, which may be a positive or negative price movement. If the prices change with lower amounts and the trade volume is heavy, it is usually perceived as a signal of a price reversal in the future. It means that if the prices were increasing over the previous long period, they might now be expected to change direction.
4. Volume and breakouts
A breakout is a change in market trends. In case there is an initial breakout from a trend in market movements, such as a range or other chart patterns, the volume can be a reliable indicator of the strength of that breakout.
A small change in volume or a steadily decreasing volume implies that there is little investor interest in the breakout. It suggests that the breakout is mort probably a false one.
5. Liquidity
Volume is also an important indicator of liquidityLiquidityIn financial markets, liquidity refers to how quickly an investment can be sold without negatively impacting its price. The more liquid an investment is, the more quickly it can be sold (and vice versa), and the easier it is to sell it for fair value. All else being equal, more liquid assets trade at a premium and illiquid assets trade at a discount. in any market. A market with high trading volumes suggests that multiple buyers and sellers are ready to trade. It makes trading extremely liquid and desirable in the short term.
Volume Indicators
For investors who consider volume while making trading decisions, certain indicators are available to them. They include the Positive Volume Index (PVI) and the Negative Volume Index (NVI). They are index calculations that represent the impact of changes in volume on price. Both the PVI and NVI are calculated based on the trading volume of the previous trading day and the current market price of the security.
The PVI is adjusted in cases where the trading volume increases in relation to the previous day. Contrarily, when the trading volume decreases relative to that of the previous day, the NVI is adjusted.
A change in PVI suggests that high volume is the major driver of price changes. When NVI changes, it implies that the changes in trading volume have little or no effect on price fluctuations.
Related Readings
CFI is the official provider of the Commercial Banking & Credit Analyst (CBCA)™Program Page - CBCAGet CFI's CBCA™ certification and become a Commercial Banking & Credit Analyst. Enroll and advance your career with our certification programs and courses. certification program, designed to transform anyone into a world-class financial analyst.
In order to help you become a world-class financial analyst and advance your career to your fullest potential, these additional resources will be very helpful:
- Dow Jones Industrial Average (DJIA)Dow Jones Industrial Average (DJIA)The Dow Jones Industrial Average (DJIA), also referred to as "Dow Jones” or "the Dow", is one of the most widely-recognized stock market indices.
- How to Read Stock ChartsHow to Read Stock ChartsIf you’re going to actively trade stocks as a stock market investor, then you need to know how to read stock charts. Even traders who primarily use fundamental analysis to select stocks to invest in still often use technical analysis of stock price movement to determine specific buy and sell, stock charting
- Momentum IndicatorsMomentum IndicatorsMomentum indicators are tools utilized by traders to get a better understanding of the speed or rate at which the price of a security changes. Momentum
- Investing: A Beginner’s GuideInvesting: A Beginner's GuideCFI's Investing for Beginners guide will teach you the basics of investing and how to get started. Learn about different strategies and techniques for trading
-

Quantitative Analysis: Definition, Methods & Applications
Quantitative analysis is the process of collecting and evaluating measurable and verifiable data such as revenues, market share, and wagesRemunerationRemuneration is any type of compensation or paymen
-

Financial Analysis: A Comprehensive Guide for Professionals
Financial analysis involves using financial dataFinancial DataWhere to find data for financial analysts - Bloomberg, CapitalIQ, PitchBook, EDGAR, SEDAR and more sources of financial data for financial
invest
- Understanding Divergence in Technical Analysis: A Guide
- Understanding Forward Prices: Definition & How They Work
- Fundamental Analysis: A Comprehensive Guide to Investment Valuation
- Understanding Hedging Strategies: A Comprehensive Guide
- Horizon Analysis: Predicting Portfolio Returns & Investment Strategies
- Net Volume Explained: Understanding Market Sentiment
- Understanding Slippage in Trading: Causes & Impact
- Technical Analysis: A Comprehensive Guide to Predicting Stock Prices
- Volume Analysis: A Comprehensive Guide for Traders & Investors
-
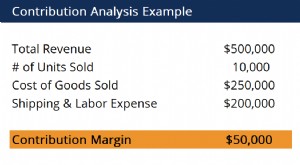 Contribution Analysis: Understanding Profitability & Cost Management
Contribution analysis is used in estimating how direct and variable costs of a product affect the net income of a company. It addresses the issue of identifying simple or overhead costs related to sev...
-
 Credit Analysis: A Comprehensive Guide to Assessing Credit Risk
Credit analysis is the process of determining the ability of a company or person to repay their debt obligations. In other words, it is a process that determines a potential borrower’s credit ri...