Horizon Analysis: Predicting Portfolio Returns & Investment Strategies
Horizon analysis is a method used to estimate a portfolio’s expected total return over a given investment horizon. It uses scenario analysisScenario AnalysisScenario analysis is a process of examining and evaluating possible events or scenarios that could take place in the future and predicting the to view a given bond swap as a well-defined mixture of components from idealized swap categories at each point in time.

Horizon analysis enables the portfolio managerPortfolio ManagerPortfolio managers manage investment portfolios using a six-step portfolio management process. Learn exactly what does a portfolio manager do in this guide. Portfolio managers are professionals who manage investment portfolios, with the goal of achieving their clients’ investment objectives. to associate the primary sources of the expected return with the portfolio. By pursuing such a route, a portfolio manager can explore the vulnerabilities of the portfolio’s expected return over a range of market conditions and eventually define and quantify different forms of risk.
Summary
- Horizon analysis compares a portfolio’s projected return over different time frames using scenario analysis to arrive at a more realistic estimate of its expected returns.
- It helps portfolio managers estimate market uncertainties and bond market yields.
- Since it is based on the planned investment horizon, the analysis simplifies calculations to give the bond market projection.
Understanding Horizon Analysis
Horizon analysis comes in handy for portfolio managers to project bonds’ performance for a planned investment period. It also enables managers to determine market risks, future market yields, and reinvestment rates over the planned investment horizon.
Expected returns are broken down into different scenarios to determine which bonds would bring the best gains over a planned horizon period. In part, the approach simplifies the computation of certain risk measures, such as yields spreads and break-even pointsBreak-even Point (BEP)Break-even point (BEP) is a term in accounting that refers to the situation where a company's revenues and expenses were equal within a specific accounting period. It means that there were no net profits or no net losses for the company - it "broke even". BEP may also refer to the revenues that are needed to be reached in order to compensate for the expenses incurred for yield levels. Profit evaluation of bonds is typically untenable using yield maturity. The dramatic changes in risk structures are also clarified in the horizon analysis.
Estimating Returns Level
Horizon analysis is based on the passage of time, which usually impacts bond investment decisions. Basically, bond market participants hold two views – one is short-term with day-to-day price movements as the main focus, and the second is long-term with the primary focus on some measures to yield-to-maturity.
However, most investors tend to explore investment horizons earlier than the earliest maturity bonds under consideration rather than those that extend beyond the current calendar year. At the same time, a workout period extending beyond the immediate months ahead – but not further than a few years into the future – gives the most comfortable projections of the bond market.
Horizon analysis is a convenient analytic tool that helps the investor explore the middle ground, “between tomorrow and maturity.” Such an analysis framework indicates the level of returns within the planned investment horizon.
Using Horizon Analysis to Relate Portfolio With Sources of Return
Value of a Bond
When an individual buys a bond, they earn income in three ways – coupon income, interest on interest, and capital gains from the sale of the bond. Coupon in this context entails coupon payments and accrued interest received in case the bond is sold in advance. Interest-on-interest is the return earned by reinvesting and compounding of the coupon income.
The interest amount on the interest-on-interest brings uncertainty because the specific vehicle and the reinvestment rates are future based and hard to predict. However, interest-on-interest can account for a significant proportion of the total return for a long-term bond, implying that it should be included during bond investment evaluation.
One way to overcome this uncertainty is to assume a constant reinvestment rates. Horizon analysis can be used to explore the uncertainty impact associated with reinvestment by breaking down the expected returns across some range of feasible values. The increase in the bond’s market value is represented as the capital gain component of return.
Shifting the Capital Gain
The three basic sources of return apply to any investment medium. Bonds produce a higher portion of income in the long term compared to other types of securities. The income results from the relatively predictable coupon and redemption flows. However, having short and intermediate-term investment maturities increases the uncertainty of the bond’s total return as they reduce the potential for capital gains.
Horizon analysis helps to compare and differentiate a bond’s return over the given periods. As a result, horizon analysis leads to an important refinement in the capital gain component through this differentiation.
Using Horizon Analysis to Estimate the Yield Accumulation Return
Horizon analysis obtains an approximate measure of the accumulating return on bonds by adding the accumulated capital gain component to the bonds return. The capital gain component is relatively free from market uncertainties associated with the daily movement of market rates. The return, also known as the yield accumulation return, can continue to grow over longer investment horizons.
In the early years, the coupon income gives approximately twice as much return as the accumulated capital gain, unlike the interest on interest, which is usually negligible. As the investment horizon gets longer, the coupon income maintains a constant growth, the interest on interest grows at an assumed rate, and the capital gain increases its contribution to the yield.
Horizon analysis uses cumulative percentage return, represented as the percentage of the current investor base. Volatility is also measured in the same fashion by incorporating the idea of volatility over time into the representation of capital gain.
More Resources
CFI is the official provider of the global Capital Markets & Securities Analyst (CMSA)™ Program Page - CMSAEnroll in CFI's CMSA® program and become a certified Capital Markets &Securities Analyst. Advance your career with our certification programs and courses.certification program, designed to help anyone become a world-class financial analyst. To keep advancing your career, the additional CFI resources below will be useful:
- Expected ReturnExpected ReturnThe expected return on an investment is the expected value of the probability distribution of possible returns it can provide to investors. The return on the investment is an unknown variable that has different values associated with different probabilities.
- Portfolio PlanningPortfolio PlanningPortfolio planning is the process of strategizing the construction of an investment portfolio. The investment portfolio should be
- VolatilityVolatilityVolatility is a measure of the rate of fluctuations in the price of a security over time. It indicates the level of risk associated with the price changes of a security. Investors and traders calculate the volatility of a security to assess past variations in the prices
- Yield To Maturity (YTM)Yield to Maturity (YTM)Yield to Maturity (YTM) – otherwise referred to as redemption or book yield – is the speculative rate of return or interest rate of a fixed-rate security.
-

Customer Profitability Analysis: Understanding & Calculating
Customer Profitability Analysis is a tool from managerial accounting that shifts the focus from product line profitabilityCost of Goods Manufactured (COGM)Cost of Goods Manufactured (COGM) is a term u
-

Debit & Credit Analysis: A Comprehensive Guide for Accountants
Accountants perform debit credit analysis at all times as part of their responsibilities. Business transactions occur daily, and it is the accountant’s role to record the transactions appropriat
invest
- Contribution Analysis: Understanding Profitability & Cost Management
- Credit Analysis: A Comprehensive Guide to Assessing Credit Risk
- Quantitative Analysis: Definition, Methods & Applications
- Financial Analysis: A Comprehensive Guide for Professionals
- Fundamental Analysis: A Comprehensive Guide to Investment Valuation
- Understanding Investment Horizon: A Comprehensive Guide
- Industry Analysis: A Comprehensive Guide for Business Insights
- Pareto Analysis: The 80/20 Rule Explained | [Your Brand/Website Name]
- Top-Down Analysis: A Comprehensive Guide for Investors
-
 Ratio Analysis: A Comprehensive Guide to Financial Statement Insights
Ratio analysis is a popular technique of financial analysis. It is used to visualize and extract information from financial statementsThree Financial StatementsThe three financial statements are the i...
-
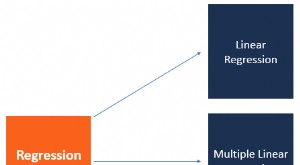 Regression Analysis: A Comprehensive Guide to Understanding Relationships
Regression analysis is a set of statistical methods used for the estimation of relationships between a dependent variable and one or more independent variablesIndependent VariableAn independent variab...