Revenue Per Employee: Definition, Calculation & Importance
Revenue per employee is an efficiency ratio used to determine the revenue generated per individual working at a company. The revenue per employee ratio is important for determining the efficiency and productivity of the average employee of a company.

Formula for Revenue Per Employee
The formula for the ratio is as follows:

Note: A variation to the formula above often used by analysts is to use net incomeNet IncomeNet Income is a key line item, not only in the income statement, but in all three core financial statements. While it is arrived at through in the numerator, as opposed to revenue.
Examples
Example 1: Facebook Inc.
John is an equity analyst conducting analysis on Facebook Inc. John’s manager asks him to analyze the productivity of an average employee at Facebook and instructs him to determine the revenue per employee for Facebook as of December 31, 2018.
Scanning through Facebook’s annual report, John finds that the number of employees at Facebook is 35,587, and the company reports revenues of $55,838 million. He determines the RPE of Facebook as follows:

John reports to his manager that Facebook’s revenue per employee is $1.5691 million per employee.
Example 2: Hypothetical Competitor Analysis
Given only the revenue and number of employees of different companies operating in the same industry, use the revenue per employee ratio to find which company is more productive:
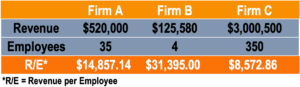
From the table above, and with only revenue and employee figures available, we conclude that Company B is the most efficiently productive company, since its RPE is $31,395, as opposed to $14,857 and $8,573 for Company A and Company C, respectively. Although Company C generates revenue in excess of $3 million, it employs a significantly higher number of employees to generate said revenue.
Example 3: Company Profitability
Recall Example 2 but consider the additional fact patterns listed below. Which company is generating a profit?
- Assume the only expenses faced by each company are salariesRemunerationRemuneration is any type of compensation or payment that an individual or employee receives as payment for their services or the work that they do for an organization or company. It includes whatever base salary an employee receives, along with other types of payment that accrue during the course of their work, which.
- A salary of $15,000 is paid to each employee in the industry, regardless of which company they are employed by.
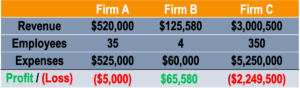
With a salary of $15,000 per employee, we can conclude that Company B is the only one that is turning a profit. This is consistent with our conclusion in Example 2 that Company B is the most efficiently productive.
Importance of Revenue Per Employee
For many companies, their largest expenses are salaries and benefits for employees. In addition, the workforce is what drives business success. Therefore, companies typically want a high RPE to offset the expenses paid to employees. Generally, a higher RPE typically indicates a more productive and efficient company. The revenue per employee ratio is particularly useful for analyzing companies that operate in service industries.
It is important to note that this metric should always be used in conjunction with other financial ratiosFinancial RatiosFinancial ratios are created with the use of numerical values taken from financial statements to gain meaningful information about a company to analyze a given firm. Additionally, the ratio should only be compared with that of other companies operating in the same or a similar industry, as each industry faces a different cost structureCost StructureCost structure refers to the types of expenses that a business incurs, and is typically composed of fixed and variable costs. Fixed costs remain unchanged. For example, a labor-intensive company will typically report a lower revenue per employee, as opposed to a technology company.
Related Readings
CFI offers the Financial Modeling & Valuation Analyst (FMVA)™Become a Certified Financial Modeling & Valuation Analyst (FMVA)®CFI's Financial Modeling and Valuation Analyst (FMVA)® certification will help you gain the confidence you need in your finance career. Enroll today! certification program for those looking to take their careers to the next level. To keep learning and advancing your career, the following CFI resources will be helpful:
- Average Revenue Per User (ARPU)Average Revenue Per User (ARPU)Average revenue per user (ARPU), also known as average revenue per unit, is a non-GAAP metric commonly used by digital media companies,
- Customer Acquisition Cost (CAC)Customer Acquisition Cost (CAC)Customer acquisition cost (CAC) is the cost related to acquiring a new customer. In other words, CAC refers to the resources and costs
- Profitability RatiosProfitability RatiosProfitability ratios are financial metrics used by analysts and investors to measure and evaluate the ability of a company to generate income (profit) relative to revenue, balance sheet assets, operating costs, and shareholders' equity during a specific period of time. They show how well a company utilizes its assets to produce profit
- Revenue vs IncomeRevenue vs IncomeRevenue vs income. This guide provides an overview of the main differences between revenue vs income. Revenue is the sales amount a company
-

Amalgamation Explained: Mergers & Corporate Combinations
In corporate financeCorporate Finance OverviewCorporate finance deals with the capital structure of a corporation, including its funding and the actions that management takes to increase the value of,
-
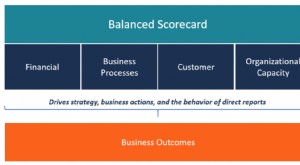
Balanced Scorecard: A Comprehensive Guide to Strategic Performance
A balanced scorecard is a strategic planning framework that companies use to assign priority to their products, projects, and services; communicate about their targets or goals; and plan their routine
finance
- Per Diem Employees: Definition, Benefits & How They Work
- Acquirer Definition: Understanding Corporate Acquisitions
- Cash Earnings Per Share (Cash EPS): A Comprehensive Guide
- Understanding Clawbacks: Protecting Stakeholders from Failed Performance
- Understanding Dividend Per Share (DPS): A Comprehensive Guide
- Understanding Financial Gearing: Debt & Leverage Explained
- Leverage in Finance: Strategies, Types & Risks
- Accrued Revenue: Definition, Examples & Accounting Explained
- Revenue Enhancement: Strategies & Techniques for Increased Income
-
 Understanding Acquisition Cost: Definitions & Applications
Acquisition cost is the cost of purchasing an asset. It is generally used in three different contexts in business, which include the following:Mergers and acquisitionsFixed assetsCustomer acquisition&...
-
 Advertising Budget: Definition, Planning & Best Practices
An advertising budget is a company’s allocation of promotional expenditures over a specified time period. It is a measure of a company’s planned expenditure on accomplishing marketing obje...