Bar Charts: Data Visualization & Technical Analysis Explained
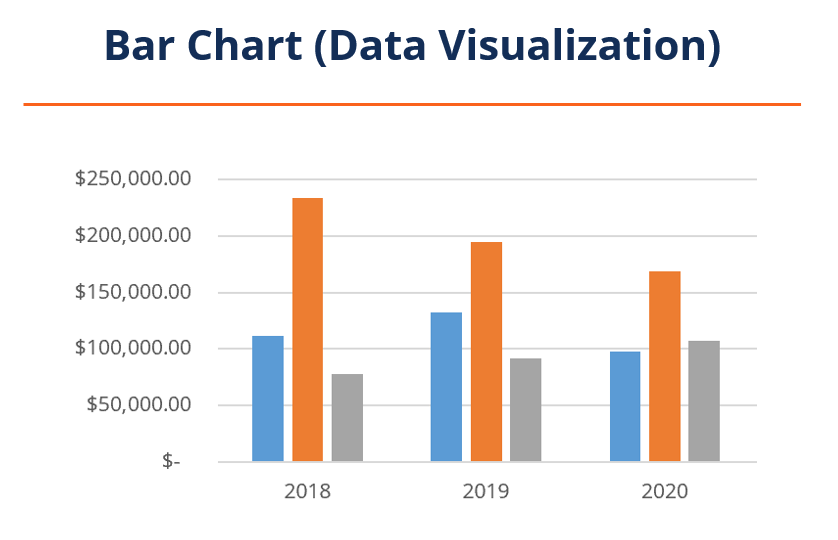
Bar charts, as a tool, can be used in two ways that are entirely different from each other. The first bar chart is used in data visualization that shows categorical data in the form of bars with varying heights or lengths based on the value it represents.
Alternatively, bar charts can be used in the technical analysisTechnical Analysis - A Beginner's GuideTechnical analysis is a form of investment valuation that analyses past prices to predict future price action. Technical analysts believe that the collective actions of all the participants in the market accurately reflect all relevant information, and therefore, continually assign a fair market value to securities. of an asset or security over time. Bar charts used in technical analysis are very different compared to the regular bar charts used in data visualization.
Bar charts in technical analysis are also referred to as open, high, low, and closing (OHLC). They are helpful in spotting trends, monitoring stock prices, and helping trading analysts make decisions.
How Bar Charts are Used – Technical Analysis
Analysts use bar charts in technical analysis to help monitor price trends, volatilityVolatilityVolatility is a measure of the rate of fluctuations in the price of a security over time. It indicates the level of risk associated with the price changes of a security. Investors and traders calculate the volatility of a security to assess past variations in the prices, security movement indicators, and more. These are used similarly to other charts in technical analysis like the Japanese candlestick to help trading analysts stay educated on their current or potential future investments.
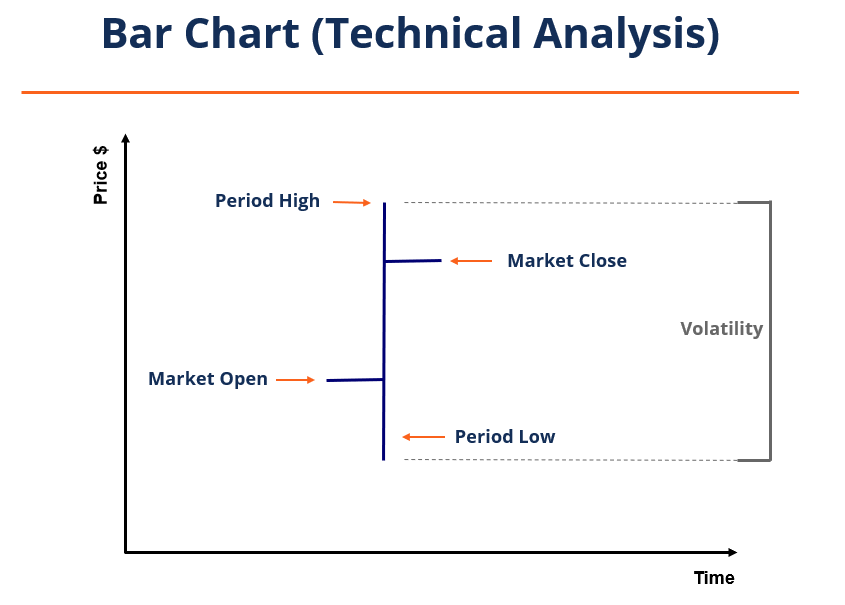
The bar chart visually shows the opening, high, low, and closing prices of a security over a given period. The image below shows how to read a bar chart. The vertical line indicates the high and low prices of the period. The horizontal line to the left shows the market opening price, and the horizontal line to the right shows the market closing price.
It also shows the volatility of the security or asset over a given period which is the change between the period high and the period low. The volatility can be calculated by taking the period high and subtracting the period low.
If the period high and the period low are close together, the security would be considered relatively nonvolatile. Conversely, if the price difference between the period high and low is large, the security would be regarded as volatile.
If the market’s opening price is below the closing price for the period, the bar chart will sometimes be colored green or black, representing security gain. Alternatively, if the market open is above the market close, the bar chart will sometimes be colored red to represent a loss on the security.
When comparing tens or hundreds of bar charts from period to period, analysts often find it helpful to use color-coding in order to understand the graph they are looking at more quickly.
Bar Charts in Use
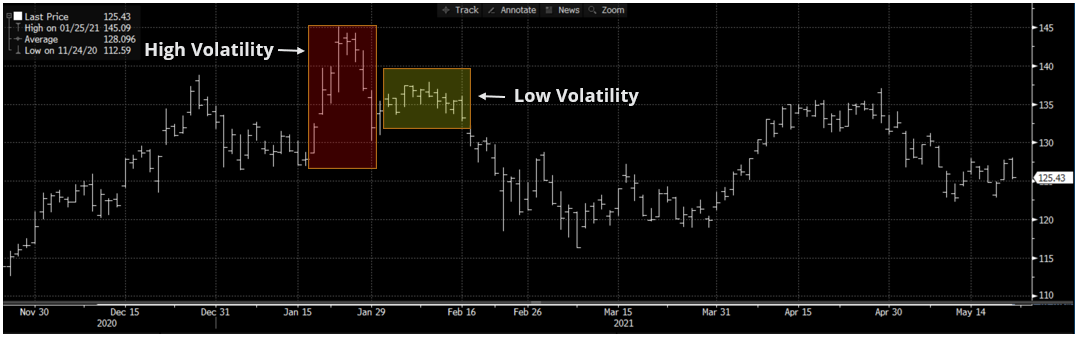
Below is an example of a bar chart of Apple, Inc. from November 21, 2020 to May 21, 2021, retrieved from Bloomberg. Highlighted in red, we can see a period of high volatility, with each period showing long bars. Slightly to the right, highlighted in yellow, we can see a period of relatively lower volatility.
Analysts will use bar charts like the one below to help them quickly spot trends in securities or assets. A bar chart alone does not provide nearly enough data or insight to warrant buying security; however, it can be a good indicator of whether or not more research should be conducted or simply pass over the investment opportunity.
Plenty of other valuable information can be taken from a bar chart. For example, if the market close is close to the period high, it could represent a more bullish outlook.
Conversely, if the market close is much lower than the period high, it means there were more sellers near the end of the period and could represent a more bearish outlook.
Data Visualization
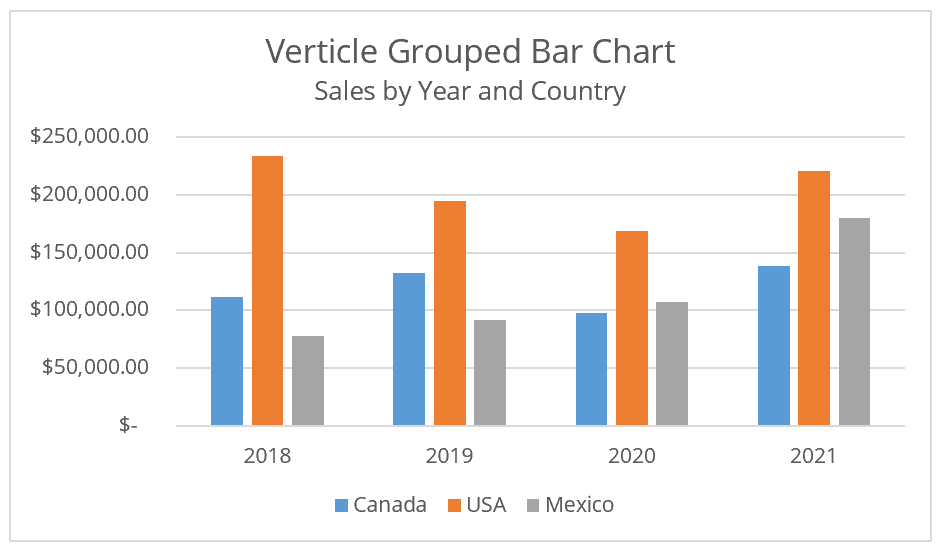
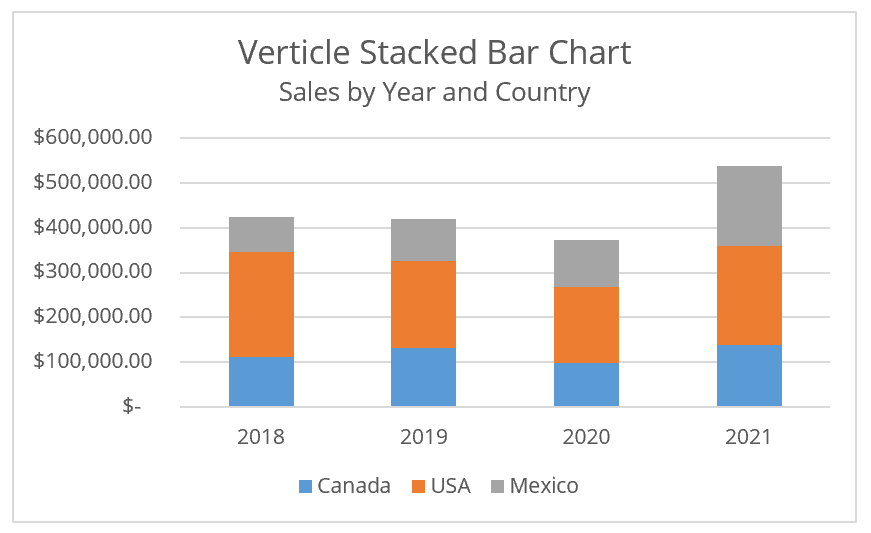
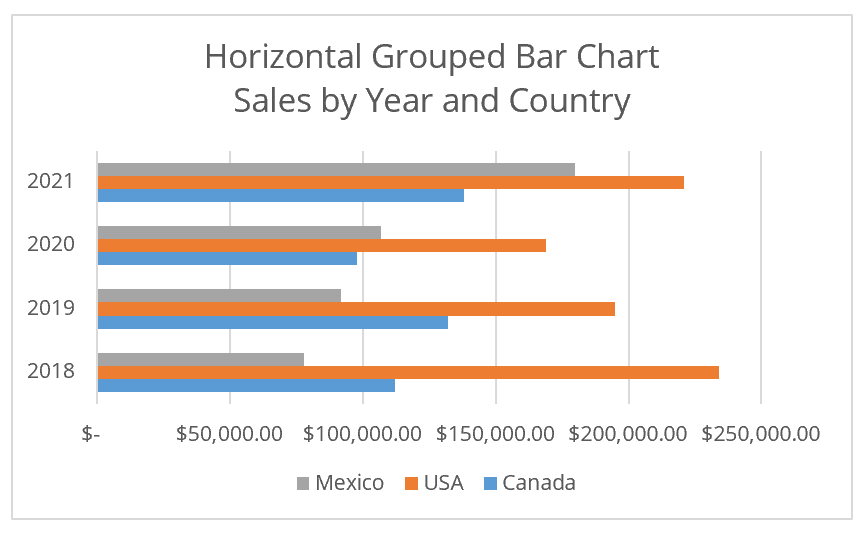
Bar charts used for data visualization are very different from when they are used for technical analysis. Bar charts in such a situation are used to show categorical data with rectangular bars either vertically or horizontally, with their lengths representing their values.
One axis of the bar chart will label the categories being compared. The other axis will show the values associated with each category. Often, bar charts will be scaled to help the data fit into the chart. However, it can misrepresent the data visually, so it is very important to read the bar chart and its axes carefully.
Types of Bar Charts
Bar charts can be created by pen and paper, or a variety of programs can be used to help turn data into bar charts. Some common software programs used in data visualization for business include ExcelExcel DefinitionExcel definition: software program by Microsoft that uses spreadsheets to organize numbers and data with formulas and functions. Excel analysis is ubiquitous around the world and used by businesses of all sizes to perform financial analysis., Tableau, Microsoft Power BI, and Google Charts. They can create a wide variety of different bar charts.
Various bar charts can be used to better represent the data you are trying to visualize. Some examples of bar charts are shown below.
More Resources
CFI is the official provider of the Capital Markets & Securities Analyst (CMSA)® Program Page - CMSAEnroll in CFI's CMSA® program and become a certified Capital Markets &Securities Analyst. Advance your career with our certification programs and courses.certification program, designed to transform anyone into a world-class financial analyst.
To keep learning and developing your knowledge of financial analysis, we highly recommend the additional resources below:
- Chart Types in TableauChart Types in TableauCharts in Tableau range from basic to advanced, and everything in between. Tableau's features let users create charts that serve many purposes.
- How to Read Stock ChartsHow to Read Stock ChartsIf you’re going to actively trade stocks as a stock market investor, then you need to know how to read stock charts. Even traders who primarily use fundamental analysis to select stocks to invest in still often use technical analysis of stock price movement to determine specific buy and sell, stock charting
- Trading StrategyTrading StrategyA trading strategy is a fixed plan for buying and selling securities designed to generate a profitable return on the investments. It should
- Power BI – Uses in FinancePower BI – Uses in FinanceThe tagline for Power BI, “Bring Your Data to Life,” very clearly demonstrates the purpose of the Microsoft-owned business analytics tool
-

Credit Analysis Ratios: A Comprehensive Guide for Investors & Analysts
Credit analysis ratiosFinancial RatiosFinancial ratios are created with the use of numerical values taken from financial statements to gain meaningful information about a company are tools that assist
-
Understanding Management Discussion & Analysis (MD&A): A Comprehensive Guide
Management discussion and analysis, or MD&A, is a section that can be found in the annual report of a company. The MD&A section provides key information regarding how a company is performing f
invest
- Understanding Price Indices: A Comprehensive Guide
- Time Series Data Analysis: A Comprehensive Overview
- Understanding Hedge Fund Fees: The 2 and 20 Structure
- Advanced Technical Analysis: A Comprehensive Guide
- Dark Cloud Cover: Understanding This Bearish Reversal Pattern
- Technical Analysis: A Comprehensive Guide to Predicting Stock Prices
- Period Costs: Definition, Examples & Impact on Financial Statements
- Bull & Bear Markets: Understanding Market Cycles
- Technical Analysis: A Comprehensive Guide for Investors
-
 Inventory Management: Types, Examples & ROI Analysis
This article outlines the many types of inventory, provides real-world examples and covers inventory management...
-
 SWOT Analysis for Personal Finance: Identify Strengths & Weaknesses
One of the best ways to get a good idea of where you stand (in just about anything) is to run a SWOT Analysis. A SWOT Analysis is a strategic management tool that is often used in business to analyze ...