Dark Cloud Cover: Understanding This Bearish Reversal Pattern
The dark cloud cover refers to a candlestick pattern in technical analysis that is a bearish reversal signal. It is observed when a “down” candle opens above the close of the previous “up” candle and proceeds to close below the midpoint of the “up” candle within a candlestick chartJapanese CandlestickJapanese Candlesticks are a technical analysis tool that traders use to chart and analyze the price movement of securities. The concept of candlestick charting was developed by Munehisa Homma, a Japanese rice trader..
Understanding Technical Analysis
The dark cloud cover is a pattern or single that is observed within technical analysis. Technical analysis is a discipline that is applied by security traders who observe patterns within historical trading data and attempt to analyze securities with this data. Generally, technical analysis traders will observe charts that give information about the price movement or trading volume of securities to draw insights on future price movements.
Clearly, technical analysis is more of a short-term trading discipline that does not involve long-term fundamental analysis of individual securities. Instead, technical analysis will focus on short-term trading signals that can evaluate a security’s investment attractiveness based on a comparison between that security’s charts and patterns against the charts and patterns of its own history or other securities.
Technical analysis can be used for any security with historical pricing data. It includes asset classes such as:
- Equities (stocks)
- Fixed income (bonds)
- Commodities
- Currencies
- FuturesFutures ContractA futures contract is an agreement to buy or sell an underlying asset at a later date for a predetermined price. It’s also known as a derivative because future contracts derive their value from an underlying asset. Investors may purchase the right to buy or sell the underlying asset at a later date for a predetermined price.
However, technical analysis is more commonly used in price-driven securities, such as commodities and currency markets.
Understanding Dark Cloud Cover
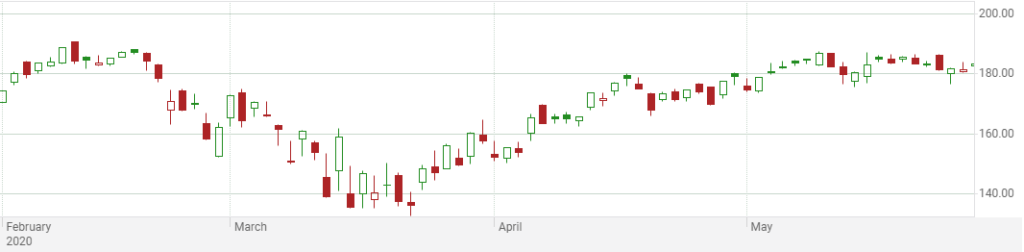
The dark cloud cover refers to a candlestick pattern that serves as a bear signal, which indicates that a persisting uptrend may reverse into an upcoming downtrend. Candlestick charts are price charts that are prevalent within technical analysis. They display the high, low, open, and closing prices of a given security over a period of time. Below is an example of a candlestick chart for Microsoft’s common stock (NASDAQ:MSFT) in 2020.
The green/white candlesticks show stronger buying pressures, while a red/black candlestick shows stronger selling pressures.
As mentioned earlier, the dark cloud cover is a pattern where the down candle opens above the close of the up candle and then closes below the midpoint of the up candle. If the price continues to trend lower by the third candle, then this is known as the confirmation. The confirmation is an additional indicator that suggests that a trend may be occurring.
Dark cloud cover patterns are taken seriously when occurring after a significant uptrend in prices for a security. The pattern is used to indicate when the uptrend will end and will shift into a downtrend. There are three stages of the dark cloud cover pattern:
- An established uptrend
- A gap that turns into a ‘down’ candle
- The down candle is below the midpoint of the previous “up” candle
Traders may use the dark cloud cover to inform their selling decisions. A trader can potentially exit a long position upon observing a dark cloud cover pattern. Or, the trader may pay more attention to a security that has exhibited such a pattern and wait for confirmation on whether to exit that position. If other “bear” patterns are observed, a trader may potentially wish to short that security as well.
The dark cloud cover is usually used to supplement other technical analysis methods. Common technical analysis indicators used are:
- Price trend indicators
- Chart pattern indicators
- Volume indicators
- Momentum indicatorsMomentum IndicatorsMomentum indicators are tools utilized by traders to get a better understanding of the speed or rate at which the price of a security changes. Momentum
- Oscillators
- Historical moving averages
- Support levels
- Resistance levels
Practical Example
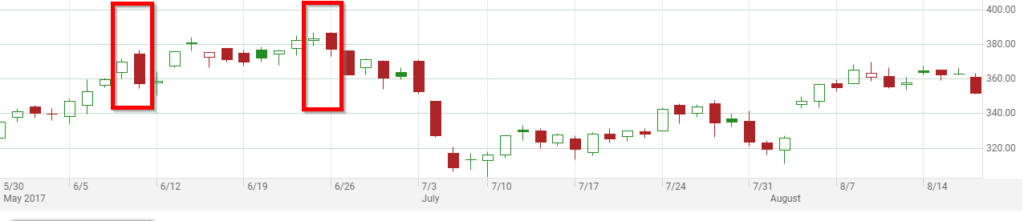
Here is an example of a candlestick chart for Tesla (NASDAQ:TSLA) – a notoriously volatile stock. There are two clear observations of a dark cloud cover here:
- The first one on the left occurs where the bear candlestick opens above the previous close of the bull candlestick and closes below the midpoint of the prior bull candlestick. However, this pattern is not followed by a confirmation candlestick (additional bull candlestick).
- The second one occurs again with a bear candlestick opening above the previous close of the bull candlestick and closes below the midpoint of the prior bull candlestick. This time, the dark cloud cover is followed by a confirmation candlestick. The confirmation candlestick is the following bear candlestick after the initial bear candlestick.
The signal could indicate to traders to exit their long positions of Tesla’s stock or to enter short positions at such points as well. Traders commonly use stop-loss orderStop-Loss OrderA stop-loss order is a tool used by traders and investors to limit losses and reduce risk exposure. Learn more about stop-loss orders in this article. instructions to limit their potential losses in case the trend reverses again.
More Resources
CFI is the official provider of the Commercial Banking & Credit Analyst (CBCA)™Program Page - CBCAGet CFI's CBCA™ certification and become a Commercial Banking & Credit Analyst. Enroll and advance your career with our certification programs and courses. certification program, designed to transform anyone into a world-class financial analyst.
In order to help you become a world-class financial analyst and advance your career to your fullest potential, these additional resources will be very helpful:
- Advanced Technical AnalysisAdvanced Technical AnalysisAdvanced technical analysis usually involves using either multiple technical indicators or a rather sophisticated (i.e., complex) indicator. "Sophisticated"
- Head and Shoulders PatternHead and Shoulders Pattern – Technical AnalysisThe head and shoulders is a pattern commonly seen in trading charts. The head and shoulders pattern is a predicting chart formation that usually indicates a reversal in trend where the market makes a shift from bullish to bearish, or vice-versa.
- SignalingSignalingSignaling refers to the act of using insider information to initiate a trading position. It occurs when an insider releases crucial information about a company that triggers the buying or selling of its stock by people who do not ordinarily possess insider information. The actions of the insider are considered a market signal to outsiders.
- TRIN IndicatorTRIN Indicator - Technical AnalysisThe TRIN indicator is short for trading index. The TRIN indicator, also known as the ARMS index because it was developed by Richard Arms, is functionally an oscillator type indicator that is primarily used to identify short-term overbought or oversold conditions in the stock market.
-
Dark Pools Explained: A Guide for Investors
A dark pool is a financial exchange or hub that is privately organized where trading of financial securities is held. Dark pools are in stark contrast to public financial exchange markets, where there
-

Understanding the Dot-Com Bubble: Causes, Impact & Lessons Learned
The dotcom bubble is a stock market bubble that was caused by speculation in dotcom or internet-based businesses from 1995 to 2000. The companies were largely those with a “.com” domain on
invest
- Dark Web Explained: What It Is, How It Works, and Risks
- A History of Technical Analysis: Pioneering Investors & Charting
- Advanced Technical Analysis: A Comprehensive Guide
- Dow 30 Explained: Understanding the Dow Jones Industrial Average
- Ichimoku Cloud: A Comprehensive Guide for Technical Analysis
- Technical Analysis: A Comprehensive Guide to Predicting Stock Prices
- Zig Zag Indicator: Trend Filtering & Support/Resistance Analysis
- 5C Analysis: A Comprehensive Framework for Business Strategy
- Technical Analysis: A Comprehensive Guide for Investors
-
 Understanding the Call Market: Trading Hours & Price Determination
The call market refers to a market where trading does not take place continuously, but only at specified times during the trading day. Prices are dictated by the exchange rather than by bids and offer...
-
 Understanding the Credit Curve: A Guide for Investors
The credit curve is the graphical representation of the relationship between the return offered by a security (credit-generating instrument) and the time to maturity of the security. It measures the i...