What is an Efficient Frontier?
An efficient frontier is a set of investment portfolios that are expected to provide the highest returns at a given level of risk. A portfolio is said to be efficient if there is no other portfolio that offers higher returns for a lower or equal amount of risk. Where portfolios are located on the efficient frontier depends on the investor’s degree of risk tolerance.

The efficient frontier is a curved line. It is because every increase in risk results in a relatively smaller amount of returns. In other words, there is a diminishing marginal return to risk, and it results in a curvature.
Diversifying the assets in your portfolio leads to increased returns and decreased risks, which leads to a portfolio that is located on the efficient frontier. Therefore, diversificationDiversificationDiversification is a technique of allocating portfolio resources or capital to a variety of investments.The goal of diversification is to mitigate losses can create an efficient portfolio that is located on a curved line.
How Does an Efficient Frontier Work?
It is represented by plotting the expected returns of a portfolio and the standard deviation of returns. The y-axis is made up of the expected returns of the portfolio. The x-axis is labeled as the standard deviation of returns, which is a measure of risk.
A portfolio is then plotted onto the graph according to its expected returns and standard deviation of returns. The portfolio is compared to the efficient frontier. If a portfolio is plotted on the right side of the chart, it indicates that there is a higher level of risk for the given portfolio. If it is plotted low on the graph, the portfolio offers low returns.
Practical Example
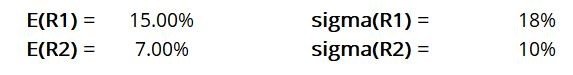
In our example, there are two assets. The first asset’s expected return is 15%, and the other shows an expected return of 7%. The standard deviationStandard DeviationFrom a statistics standpoint, the standard deviation of a data set is a measure of the magnitude of deviations between values of the observations contained of the first asset is 18%, whereas the second asset shows a standard deviation of 10%. The table below shows the standard deviation and expected returns for a portfolio that consists of both assets. When data points in the table are plotted, it shows an efficient frontier.
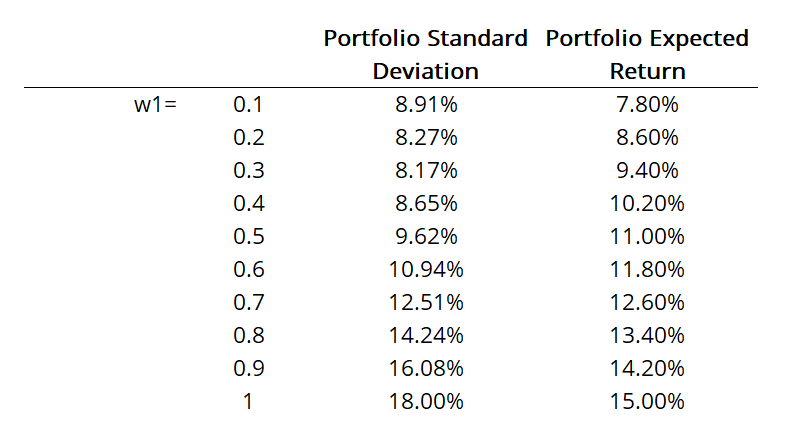
Image from CFI’s Efficient Frontier and CAL TemplateEfficient Frontier and CAL TemplateThis efficient frontier and CAL template demonstrates how to construct a portfolio frontier and CAL line chart to find the optimal portfolio. The efficient frontier A portfolio frontier is a graph that maps out all possible portfolios with different asset weight combinations, with levels of portfolio standard deviation
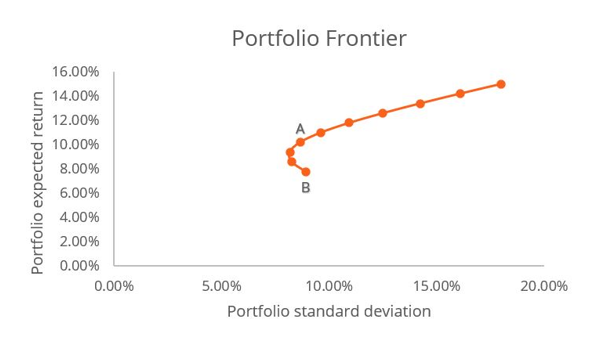
Image from CFI’s Efficient Frontier and CAL TemplateEfficient Frontier and CAL TemplateThis efficient frontier and CAL template demonstrates how to construct a portfolio frontier and CAL line chart to find the optimal portfolio. The efficient frontier A portfolio frontier is a graph that maps out all possible portfolios with different asset weight combinations, with levels of portfolio standard deviation
According to the mean-variance criterion, Portfolio A is a better choice than Portfolio B if E(R)A ≥ E(R)B and σA ≤ σB. In other words, investors will prefer Portfolio A if the expected returns for Portfolio A are higher than Portfolio B, and Portfolio A’s standard deviation is lower than Portfolio B’s.
From the graph, it can be seen that there are two portfolios located at point A and point B. The mean-variance criterion demonstrates how portfolio A is a better investment than portfolio B because portfolio A provides higher expected returns for a slightly lower amount of risk.
Significance of an Efficient Frontier
The efficient frontier is the foundation for modern portfolio theoryModern Portfolio Theory (MPT)The Modern Portfolio Theory (MPT) refers to an investment theory that allows investors to assemble a portfolio of assets that maximizes expected return for, which is the idea of how investors aim to create a portfolio that maximizes expected returns based on a specific level of risk. It helps investors understand the potential risks and returns in their portfolios and analyze how they compare to the optimal set of portfolios that are considered to be efficient. Doing so helps investors to accordingly change their investing strategies by understanding the level of risk that pertains to each portfolio.
It should be noted that there is no single efficient frontier for everyone. Each one is different for every investor because it depends on multiple factors – such as the number of assets in the portfolio, the industry of the assets, and the degree of the investor’s risk tolerance.
Limitations of an Efficient Frontier
The efficient frontier is built on assumptions that may not accurately portray realistic situations. For example, it assumes that all investors think rationally and avoid risks. It also assumes that fluctuations in market prices do not depend on the number of investors, and all investors enjoy equal access to borrowing money at a risk-free interest rate.
Such assumptions are not always true, as some investors may not make rational decisions, and some investors are high risk-takers. Not all investors obtain equal access to borrowing money as well.
Additionally, it assumes that asset returns result in a normal distributionNormal DistributionThe normal distribution is also referred to as Gaussian or Gauss distribution. This type of distribution is widely used in natural and social sciences. The. However, in reality, asset returns often do not follow a normal distribution, as it often varies three standard deviations away from the mean.
More Resources
CFI offers financial modeling courses and training programs for you to become a certified Capital Markets & Securities Analyst (CMSA)Program Page - CMSAEnroll in CFI's CMSA® program and become a certified Capital Markets &Securities Analyst. Advance your career with our certification programs and courses.™Program Page - CMSAEnroll in CFI's CMSA® program and become a certified Capital Markets &Securities Analyst. Advance your career with our certification programs and courses.. To continue learning more about topics in finance and expand your skills in being a Financial Analyst, these resources will be helpful:
- Capital Asset Pricing Model (CAPM)Capital Asset Pricing Model (CAPM)The Capital Asset Pricing Model (CAPM) is a model that describes the relationship between expected return and risk of a security. CAPM formula shows the return of a security is equal to the risk-free return plus a risk premium, based on the beta of that security
- WACCWACCWACC is a firm’s Weighted Average Cost of Capital and represents its blended cost of capital including equity and debt.
- Capital Allocation Line (CAL) and Optimal PortfolioCapital Allocation Line (CAL) and Optimal PortfolioStep by step guide to constructing the portfolio frontier and capital allocation line (CAL). The Capital Allocation Line (CAL) is a line that graphically depicts the risk-and-reward profile of risky assets, and can be used to find the optimal portfolio.
- Portfolio VariancePortfolio VariancePortfolio variance is a statistical value that assesses the degree of dispersion of the returns of a portfolio. It is an important concept in modern investment theory. Although the statistical measure by itself may not provide significant insights, we can calculate the standard deviation of the portfolio using portfolio variance.
-

Active Bond Portfolio Management: Strategies & Benefits
A bond portfolio can be managed in several ways; however, the primary methods are active, passive, or a hybrid of the two. Active bond portfolio management, as the name suggests, means the portfolio m
-

Investment Diversification: A Comprehensive Guide
Imagine you’re walking down the street, minding your own business, when all of a sudden you walk past a candy shop, the kind where you can scoop the candy out of bins and fill up a plastic bag full of
invest
- Portfolio Variance: Understanding Risk and Diversification
- Active Management: Strategies & How It Works | [Your Company Name]
- Understanding Financial Benchmarks: A Comprehensive Guide
- Bullet Bond Portfolios: A Comprehensive Guide
- Fixed Income Portfolio: Definition, Types & Benefits
- Investment Portfolio: Definition, Types & Building a Strong One
- Laddered Bond Portfolio: A Risk-Mitigating Investment Strategy
- Understanding Market Efficiency: A Comprehensive Guide
- Portfolio Rebalancing: A Comprehensive Guide for Investors
-
 Portfolio Turnover Ratio: Definition, Calculation & Significance
The portfolio turnover ratio is the rate of which assets in a fund are bought and sold by the portfolio managers. In other words, the portfolio turnover ratio refers to the percentage change of the as...
-
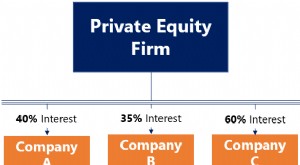 Portfolio Companies: Definition & How Private Equity Uses Them
A portfolio company is a company (public or private) that a venture capital firm, buyout firm, or holding company owns equity. In other words, companies that private equity firms hold an interest in a...