Understanding the Forward Curve: A Comprehensive Guide
The forward curve or the future curve is the graphicalTypes of GraphsTop 10 types of graphs for data presentation you must use - examples, tips, formatting, how to use them for effective communication and in presentations. representation of the relationship between the price of forward contractsFutures and ForwardsFuture and forward contracts (more commonly referred to as futures and forwards) are contracts that are used by businesses and investors to hedge against risks or speculate. and the time to maturity of the contracts. The vertical axis measures the price of a forward contract, and the horizontal axis measures the time to maturity of that forward contract.
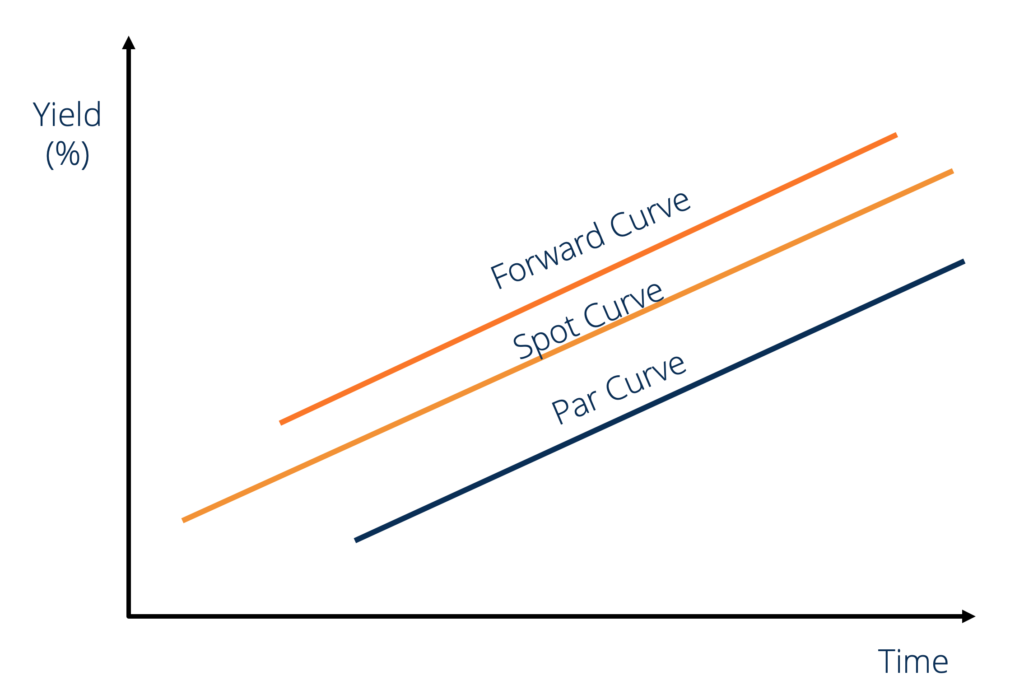
The forward curve is static in nature and represents the relationship between the price of a forward contract and the time to maturity of that forward contract at a specific point of time. When the Spot Rave is upward sloping, the forward curve will be above it, and the par curve will be below it. The image bellow illustrates this.
What are Forward Contracts?
A forward contract is a commitment to sell or purchase goods for a specified price at a future date. A forward contract comprises two main components:
- The term length, i.e., how far into the future the transaction will take place.
- The priceSpot PriceThe spot price is the current market price of a security, currency, or commodity available to be bought/sold for immediate settlement. In other words, it is the price at which the sellers and buyers value an asset right now., i.e., at what price will the transaction happen.
Standardized forward contracts are for pre-determined amounts and only specify the term length. For example, a standard 1oz forward contract for gold with a delivery date of January 31, 2019 guarantees its holder 1oz of gold on January 31, 2019. Similarly, a {October 31, 2019, 1oz-silver} contract guarantees its holder 1oz of silver on October 31, 2019.
Normal Forward Curve
The normal forward curve is the graphical representation of the positive relationship between the price of a forward contract and the time to maturity of that forward contract. The normal forward curve is a positively sloped curve in time-price space. A normal forward contract is associated with positive net carry costs.
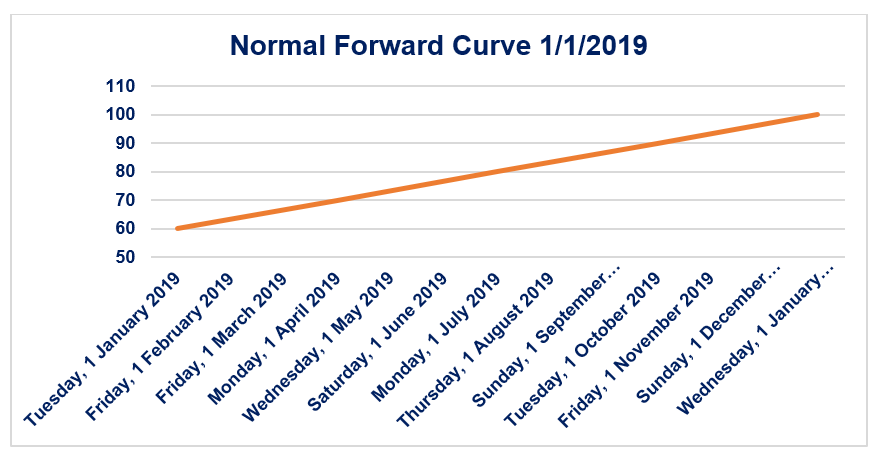
Consider the forward curve shown above. Let us assume that it is the forward curve of a standard silver forward contract. Therefore, the price on January 1, 2019 of a {January 1, 2019, 1oz-silver} contract is $60. It is the spot price of silver in the market.
Similarly, the price on January 1, 2019 of a {April 1, 2019, 1oz-silver} contract is $70. If the market for forward contracts is efficient (i.e., there is no scope for arbitrage), then the 3-month net carry cost between January 1, 2019 and April 1, 2019 for 1oz of silver is $10 (i.e., it would cost an investor $10 to store 1oz of silver for the period January 1, 2019-April 1, 2019).
Inverted Forward Curve
The inverted forward curve is the graphical representation of the negative relationship between the price of a forward contract and the time to maturity of that forward contract. The inverted forward curve is a negatively sloped curve in time-price space. An inverted forward curve is associated with negative net carry costs.
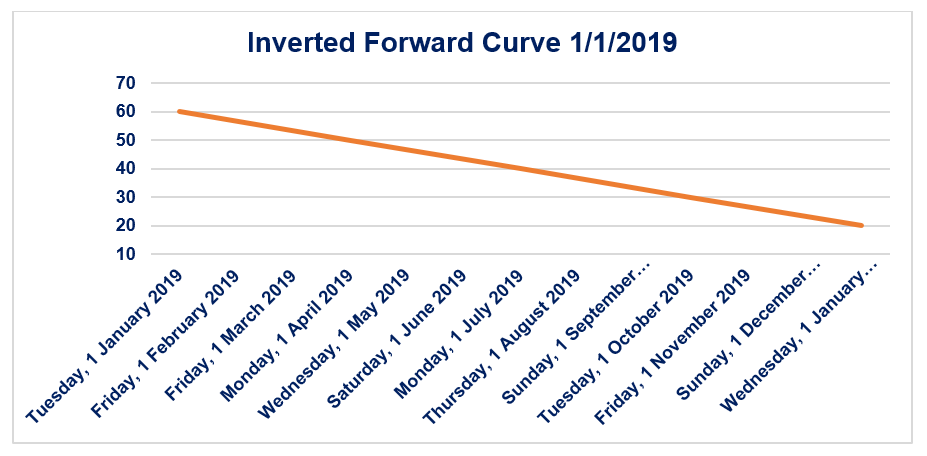
Consider the forward curve shown above. Let us assume that this is the forward curve of a standard silver forward contract. Therefore, the price on January 1, 2019 of a {January 1, 2019, 1oz-silver} contract is $60. It is the spot price of silver in the market.
Similarly, the price on January 1, 2019 of a {April 1, 2019, 1oz-silver} contract is $50. If the market for forward contracts is efficient (i.e., there is no scope for arbitrage), then the 3-month net carry cost between January 1, 2019 and April 1, 2019 for 1oz of silver is -$10 (i.e., it would cost an investor -$10 to store 1oz of silver for the period January 1, 2019-April 1, 2019.)
What is Contango Theory?
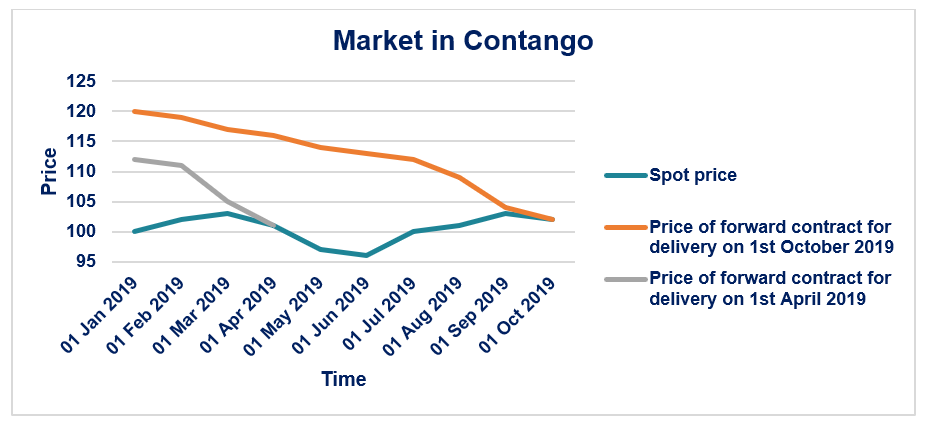
The Contango Theory states that market places a premium on forward contracts over the expected spot price of that commodity on the delivery date. If a {December 31, 2019 1oz-silver} contract is $100, then the expected spot price of 1oz of silver on December 31, 2019 is less than $100. A market is said to be in contango if the forward/future contract price decreases over time to the spot price as it gets closer to the delivery date.
Consider the graph shown below. The spot price of 1oz of silver on January 1, 2019 is $100. The price of a {April 1, 2019, 1oz-silver} contract on January 1, 2019 is $112. As time passes and we get closer and closer to April 1, 2019, the price of a {April 1, 2019, 1oz-silver} contract converges (by decreasing) to the actual price ($101) of 1oz of silver on April 1, 2019.
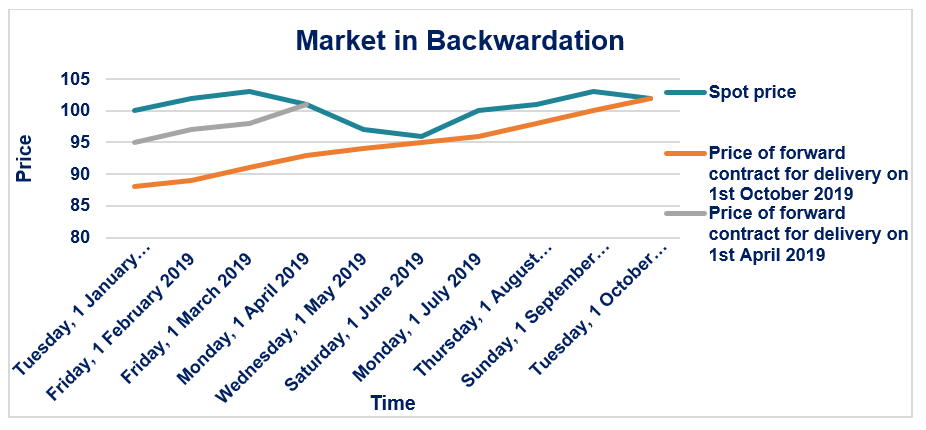
What is Backwardation Theory?
The Backwardation Theory states that market places a negative premium on forward contracts over the expected spot price of that commodity on the delivery date. If a {December 31, 2019 1oz-silver} contract is $100, then the expected spot price of 1oz of silver on December 31, 2019 is more than $100. A market is said to be in backwardation if the forward/future contract price increases over time to the spot price, as it gets closer to the delivery date.
Consider the graph shown below: The spot price of 1oz of silver on January 1, 2019 is $100. The price of a {April 1, 2019, 1oz-silver} contract on January 1, 2019 is $95. As time passes and we get closer and closer to April 1, 2019, the price of a {April 1, 2019, 1oz-silver} contract converges (by increasing) to the actual price ($101) of 1oz of silver on April 1, 2019.
Additional Resources
CFI is the official provider of the global Financial Modeling & Valuation Analyst (FMVA)™Become a Certified Financial Modeling & Valuation Analyst (FMVA)®CFI's Financial Modeling and Valuation Analyst (FMVA)® certification will help you gain the confidence you need in your finance career. Enroll today! certification program, designed to help anyone become a world-class financial analyst. To keep advancing your career, the additional resources below will be useful:
- Arbitrage Pricing TheoryArbitrage Pricing TheoryThe Arbitrage Pricing Theory (APT) is a theory of asset pricing that holds that an asset’s returns can be forecasted with the linear relationship of an
- Forward RateForward RateThe forward rate, in simple terms, is the calculated expectation of the yield on a bond that, theoretically, will occur in the immediate future, usually a few months (or even a few years) from the time of calculation. The consideration of the forward rate is almost exclusively used when talking about the purchase of Treasury bills
- Guide to Commodity TradingGuide to Commodity Trading SecretsSuccessful commodity traders know the commodity trading secrets and distinguish between trading different types of financial markets. Trading commodities is different from trading stocks.
- Option Pricing ModelsOption Pricing ModelsOption Pricing Models are mathematical models that use certain variables to calculate the theoretical value of an option. The theoretical value of an
-

Understanding Adjusted Closing Price: A Comprehensive Guide
The adjusted closing price is a calculation adjustment made to a stock’s closing price. The original closing price is the final price in which a stock, or any other particular kind of security,
-
Understanding At-The-Money (ATM) Options: A Comprehensive Guide
At the money (ATM) describes a situation when the strike price of an option is equal to the underlying asset’s current market price. It is a concept of moneyness, which describes the position be
invest
- Understanding Backwardation: Spot vs. Futures Prices
- Understanding Forward Rates: A Comprehensive Guide
- Understanding the Yield Curve: Definition & Significance
- Black-Scholes Model: Understanding Stock Option Pricing
- Understanding the Credit Curve: A Guide for Investors
- Double Top Pattern: Definition, Trading Signals & Analysis
- Understanding the Flat Yield Curve: Causes & Implications
- Understanding Forward Prices: Definition & How They Work
- Understanding the Experience Curve: Cost Reduction & Efficiency
-
 Understanding Silver Price Fluctuations: Key Factors & Trends
Many factors affect the price of silver beyond its decorative value. For its applicability in jewelry, photography and electronics, silver has long been in demand as a precious metal and an i...
-
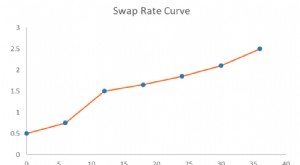 Understanding Swap Rate Curves: A Comprehensive Guide
The swap rate curve is a chart that depicts the relationship between swap rates and all available corresponding maturities. Essentially, it indicates the expected returnsExpected ReturnThe expected re...