Understanding the Flat Yield Curve: Causes & Implications
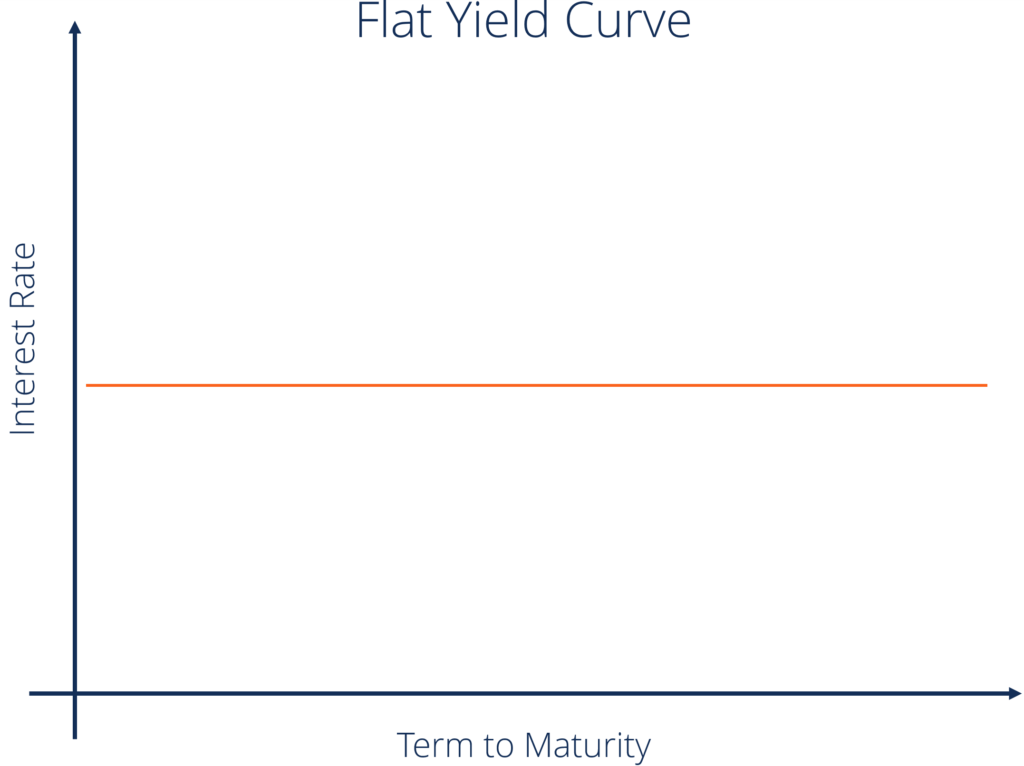
A flat yield curve is a type of yield curve that occurs when anticipated interest rates are steady, or short-term volatility outweighs long term volatility. It signifies that the difference between yields on short-term and long-term bonds minimize, in effect giving no incentives for investors and lenders to lend for the long term.
The flat yield curve is always depicted like the graph below, plotting yield (interest rate) against maturity.
When a flat yield curve occurs, it often signals uncertainty in the market and could make investors wary of making any investments or going “long” in the market. Often, economists and investors will use a flat yield curve as an economic indicatorEconomic IndicatorsAn economic indicator is a metric used to assess, measure, and evaluate the overall state of health of the macroeconomy. Economic indicators of a potential recession.
In essence, a flat yield curve signals to the market that institutions and individuals with the money to loan are worried about loaning it in the future, so they decide to loan it today. In a recession, fewer loans will be written, as there will be less overall activity in the market.
Summary
- When a flat yield curve exists, investors get the same amount of money for short-term investments as they do for long-term investments.
- For lenders, a flat yield curve may also indicate that we are about to enter a period of lower expectations for inflation soon.
- Often, economists and investors will use a flat yield curve as an economic indicator of a potential recession.
Usages of the Flat Yield Curve – The Federal Reserve
A flat yield curve can also indicate things other than a recession. Market forces are generally efficient; however, the Federal Reserve can manipulate the market by introducing monetary policy measures whenever they are relevant or deemed necessary. The Federal ReserveFederal Reserve (The Fed)The Federal Reserve is the central bank of the United States and is the financial authority behind the world’s largest free market economy. can change the overnight rate, which often will cause lending and financial institutions to change the interest rates that they give to the public.
An artificial increase by the Fed on short-term rates can often influence the yield curve and may begin to flatten it. It may be a warning sign for investors that we are entering into a recessionRecessionRecession is a term used to signify a slowdown in general economic activity. In macroeconomics, recessions are officially recognized after two consecutive quarters of negative GDP growth rates., but a flattening yield curve may ultimately result from Federal Reserve policy; thus, investors should use caution when examining a yield curve and use it as only one indicator of market conditions.
The Flat Yield Curve – An Indicator for Lenders
For lenders, a flat yield curve may also indicate that we are about to enter a period of lower expectations for inflation soon. Lenders and investors want the yield on long-term investments to make up for the effect of inflation on their investment. However, when a yield curve has flattened and inflation is expected to be low, investors will be less concerned about the effect inflation will have and will be looking at the opportunity costOpportunity CostOpportunity cost is one of the key concepts in the study of economics and is prevalent throughout various decision-making processes. The of a long-term investment.
Simply put, when a flat yield curve exists, investors get the same amount of money for short-term investments as they do for long-term investments. They can have many effects on the market, including reducing long-term investments due to no net benefit over short-term investments. In such a market, many investors will flock towards short-term bonds over long-term bonds, as they incur none of the risks of having their finances tied up in a long-term bond with identical profit and upside.
Related Readings
CFI offers the Capital Markets & Securities Analyst (CMSA)™Program Page - CMSAEnroll in CFI's CMSA® program and become a certified Capital Markets &Securities Analyst. Advance your career with our certification programs and courses. certification program for those looking to take their careers to the next level. To keep learning and developing your knowledge base, please explore the additional relevant resources below:
- Efficient Markets HypothesisEfficient Markets HypothesisThe Efficient Markets Hypothesis is an investment theory primarily derived from concepts attributed to Eugene Fama's research work.
- Headline InflationHeadline InflationHeadline inflation is the total inflation in an economy. The headline inflation figure includes inflation in a basket of goods that includes
- Normal Yield CurveNormal Yield CurveA normal yield curve is a graph that shows the association between the yield on bonds and maturities. In a normal yield curve, short-term debt instruments
- Overnight RateOvernight RateThe overnight rate refers to the interest rate that depository institutions (e.g., banks or credit unions) charge each other for overnight lending. Note that the overnight rate is called something different in different countries.
-
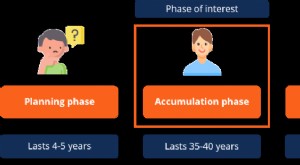
Understanding the Investment Accumulation Phase: Building Wealth Over Time
The accumulation phase refers to the time in the life cycle of an investment when an individual or an investor builds up the value of their annuity or investment. It is the second phase in the process
-

Bandwagon Effect: Understanding Social Influence & Conformity
The bandwagon effect is the tendency of people to take certain actions or arrive at a conclusion primarily because other people are doing so. The phenomenon is observed in various fields, such as econ
invest
- Understanding Inverted Yield Curves: Recession Indicator?
- Understanding Yield Curve Rollover: A Fixed Income Strategy
- Understanding Swap Rate Curves: A Comprehensive Guide
- Understanding the Yield Curve: Definition & Significance
- Understanding the Credit Curve: A Guide for Investors
- Understanding the Forward Curve: A Comprehensive Guide
- Understanding the Par Yield Curve: A Guide for Investors
- Understanding the Experience Curve: Cost Reduction & Efficiency
- Understanding the Economic Implications of an Inverted Treasury Yield Curve
-
 Understanding Movement Along the Demand Curve: A Comprehensive Guide
It is axiomatic among economists that nearly all principles in economics bear some relationship to supply and demand, be it for goods, services or labor. Both of these factors are closely linked and o...
-
![Yield to Maturity (YTM): Definition & Calculation | [Your Brand/Website Name]](https://www.etffin.com/article/uploadfiles/202110/2021100815185913_S.jpeg) Yield to Maturity (YTM): Definition & Calculation | [Your Brand/Website Name]
Yield to Maturity (YTM): Definition & Calculation | [Your Brand/Website Name]Yield to Maturity (YTM) – otherwise referred to as redemption or book yieldYieldYield is defined as an income-only return on investment (it excludes capital gains) calculated by taking dividends...