Ichimoku Cloud: A Comprehensive Guide for Technical Analysis
The Ichimoku Cloud is a technical analysisTechnical Analysis - A Beginner's GuideTechnical analysis is a form of investment valuation that analyses past prices to predict future price action. Technical analysts believe that the collective actions of all the participants in the market accurately reflect all relevant information, and therefore, continually assign a fair market value to securities. method that was created by Japanese journalist Goichi Hosoda in the late 1960s. The Ichimoku chart shows support and resistance levels, as well as other essential information such as trend direction and momentum. Compared to standard candlestick charts, the Ichimoku Cloud contains more data points, increasing the accuracy of forecast price moves.
The Ichimoku Indicator includes many lines and information that may be complicated for inexperienced traders to understand. However, traders who know how to read and interpret the Cloud use it as a key tool for trading.
Components of the Cloud
Several elements make up the Ichimoku Cloud. The elements consist of the following five moving averages:
1. Tenkan-Sen
The first component of the Ichimoku Cloud is the Tenkan-Sen, often represented by a red line on the chart. It is a moving average that is calculated by taking the average of the high and the low for the last nine periods. The market is deemed to be trending if the Tenkan-Sen is moving up or down. However, if the line moves horizontally, it indicates a ranging market. It is calculated as follows:
Tenkan-Sen = (9-Period Highest High + 9-Period Lowest Low) / 2
2. Kijun-Sen
The Kijun-Sen is a support/resistance line that acts as an indicator of price movementsSwing TradingSwing trading is a trading technique that traders use to buy and sell stocks when indicators point to an upward (positive) or downward (negative) trend in the future. It is usually represented by a blue line. The Kijun-Sen is similar to the Tenkan-Sen, but takes a longer time frame into consideration, usually 26 periods compared to Tenkan-Sen’s nine periods. It measured by taking the average of the highs and lows for the last 26 periods. When plotted on a chart, the Kijun-sen typically lags behind the Tenkan-sen since the former comprises longer periods than the latter.
Kijun-Sen= (26-Period High + 26-Period Low) / 2
3. Senkou Span A
Senkou Span is the average of the highs and lows of Tenkan-Sen and Kijun-Sen and is plotted 26 periods to the right. On a chart, the Senkou span A is represented by an orange line. If the security price is above the Senkou span A (orange line), the top and the bottom lines become the first and second support levels, respectively. Conversely, when the price moves below the Senkou span A, the bottom and the top lines become first and second resistance levelsResistance LineA Resistance Line, sometimes also known as a Speed Line, helps identify stock trends and levels of support and resistance. Resistance lines are technical indication tools used by equity analysts and investors to determine the price trend of a specific stock., respectively.
Senkou Span A = (Tenkan-Sen + Kijun Sen) / 2
4. Senkou Span B
It is calculated by taking the average of the high and low of the past 52 periods and plotting it 26 points to the right.
Senkou Span B = (52-Period High+ 52-Period Low) / 2
5. Chikou Span
The Chikou Span, also known as the lagging span, is represented by a green line. It is formed by taking the current price and shifting it back 26 periods to the left. If the Chikou span crosses the price from the bottom-up, it demonstrates a buy signal. However, if the line crosses the price from the top-down, it is a sell signal.
Ichimoku Cloud Signals
The cloud provides the trend direction, and it also indicates support and resistance levels. It is formed by the two Senkou Span lines, A and B. The trend is dependent on the location of price vis-a-vis the cloud. For example, when the price is above the cloud, the trend is up, while the trend is down when the price is below the cloud. If the price is in the Ichimoku Cloud, the trend is flat or undetermined.
The strength of the trend can also be influenced by the position of Senkou span A and B. For example, when A moves above B, the trend is stronger in the bottom-up direction, while the opposite is true when Senkou span B moves above Senkou Span A.
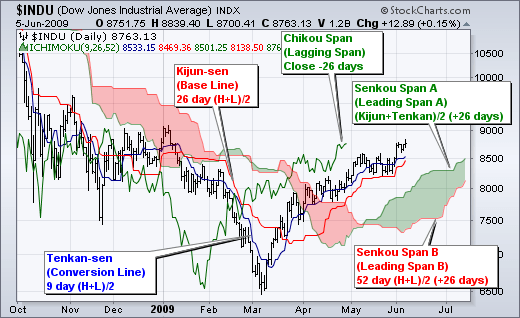
When the Tenkan-Sen line moves above the Kijun-Sen line, this is a buy signal. Ideally, the two lines and the security price should be above the Ichimoku Cloud. On the other hand, when the Tenkan line (red line) intersects and goes below the Kijun-Sen line, it yields a sell signal. The two components and the price should also be located below the cloud. Traders may use other indicators like the Relative Strength IndexRelative Strength Index (RSI)The Relative Strength Index (RSI) is one of the most popular and widely used momentum oscillators. It was originally developed by the famed mechanical engineer turned technical analyst, J. Welles Wilder. The RSI measures both the speed and rate of change in price to complement the Ichimoku Cloud indicator with the goal of maximizing their risk-adjusted returns.
Limitations of the Cloud
One of the downsides of the Ichimoku Cloud is that it is based on historical data. Historical tendencies may not repeat in the future as traders may expect.
Like any technical indicator, the Ichimoku Cloud may produce false signals. Also, depending on the time frame the indicator is applied to, it may not account for larger trends.
Related Readings
Thank you for reading CFI’s explanation of the Ichimoku Cloud. CFI is the official provider of the global Financial Modeling & Valuation Analyst (FMVA)™Become a Certified Financial Modeling & Valuation Analyst (FMVA)®CFI's Financial Modeling and Valuation Analyst (FMVA)® certification will help you gain the confidence you need in your finance career. Enroll today! certification program, designed to help anyone become a world-class financial analyst. To keep advancing your career, the additional resources below will be useful:
- How to Read Stock ChartsHow to Read Stock ChartsIf you’re going to actively trade stocks as a stock market investor, then you need to know how to read stock charts. Even traders who primarily use fundamental analysis to select stocks to invest in still often use technical analysis of stock price movement to determine specific buy and sell, stock charting
- McClellan OscillatorMcClellan Oscillator - Technical AnalysisThe McClellan Oscillator is a type of momentum oscillator. The McClellan Oscillator is calculated using exponential moving averages, and is designed to indicate the strength or weakness of price movement, rather than its direction.
- Three Best Stock SimulatorsThree Best Stock SimulatorsThe best stock simulators allow the user to practice and refine their investment techniques. Stock trading simulators allow trading fake cash with real time data, enabling traders to test out various trading strategies prior to risking any real money on them.
- Triangle Patterns – Technical AnalysisTriangle Patterns - Technical AnalysisThe triangle patterns are common chart patterns every trader should know. Triangle patterns are important because they help indicate the continuation of a bullish or bearish market. They can also assist a trader in spotting a market reversal.
-

Kairi Relative Index (KRI): Definition & Technical Analysis
The Kairi Relative Index (KRI) is a type of oscillator indicator. It measures the deviation of an asset price from its daily average over a certain period of time, usually 10 to 20 days. The index was
-
On-Balance Volume (OBV): Understanding Trading Momentum
On-Balance Volume Indicator (OBV) refers to a technical indicator of momentum that utilizes the positive or negative flow of the volume of trading to reflect the relative buying and selling pressure o
invest
- Black-Scholes Model: Understanding Stock Option Pricing
- Double Top Pattern: Definition, Trading Signals & Analysis
- Understanding the Forward Curve: A Comprehensive Guide
- Understanding the Heath-Jarrow-Morton (HJM) Interest Rate Model
- Heston Model: Understanding Volatility in Financial Options
- Understanding Market Support: What is 'Holding the Market'?
- Understanding Offering Price: A Guide for Investors
- Understanding Quoted Prices: A Comprehensive Guide
- Understanding Strike Price: Options Trading Explained
-
 Understanding Dead Cat bounces: A Stock Market Indicator
The dead cat bounce describes a financial phenomenon whereby a stock in a steady decline suddenly, and without a logical cause, gains value temporarily before continuing its downward trend. The term o...
-
 Exponential Moving Average (EMA): Definition & Trading Uses
The Exponential Moving Average (EMA) is a technical indicator used in trading practices that shows how the price of an asset or securitySecurityA security is a financial instrument, typically any fina...