Dow 30 Explained: Understanding the Dow Jones Industrial Average
The Dow 30, or Dow Jones Industrial Average, is a stock index that tracks the performance of the 30 biggest companies listed on the stock indices in the United States. Despite being used by analysts to track the markets, the Dow 30 doesn’t provide an accurate image of the U.S. stock market, as it only tracks the 30 largest companies in the United States compared to the S&P 500S&P 500 IndexThe Standard and Poor’s 500 Index, abbreviated as S&P 500 index, is an index comprising the stocks of 500 publicly traded companies in the or Russell 3000.
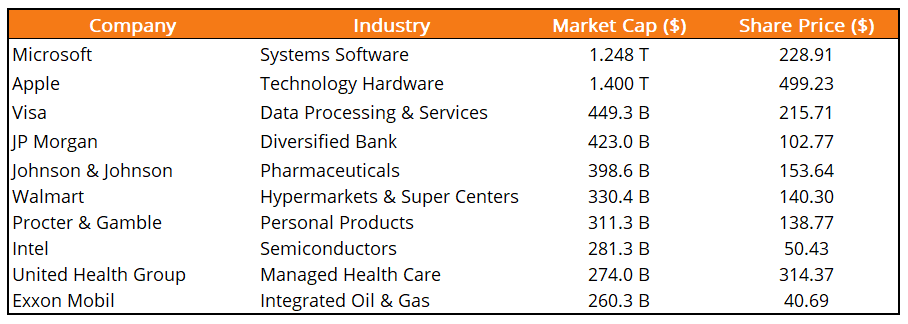
Below are the top 10 companies on the Dow 30 Index as of February 2020.
Summary
- One of the oldest indices, the Dow 30 tracks the top 30 biggest companies in the U.S.
- The downside of the Dow 30 is that since it tracks only a few companies, it isn’t a good measure to represent the US economy. It also doesn’t track many important industries like real estate or utilities.
- The Dow Futures is a contract that is based on the performance of the Dow 30.
Calculation of the Dow 30
The points on the Dow 30 Index is calculated by dividing the total of all share prices on the index divided by the Dow divisorDow DivisorThe Dow divisor, in simple terms, is a number used to help calculate the Dow Jones Industrial Average (DJIA). The divisor began as the equivalent of the. The Dow divisor is updated when the company on the index completes a stock split, as it can impact the share price of that company.
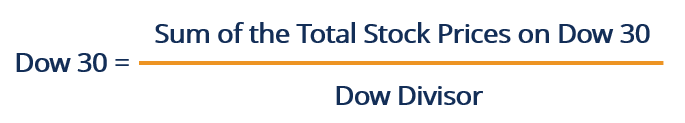
As of June 2020, the Dow divisor was 0.1458. Therefore, a 1% change in the share price of a company on the index will lead to a change of 6.8587 points on the index.
Problems with the Dow 30
The downside of calculating the Dow 30 is that a company on the index with the largest share price can influence the points on the index, which can be an incorrect measure for analyzing the movements in the stock market.
For example, as per the diagram with the top 10 companies, Apple records the highest share price of $499.23 per share, while Exxon Mobil’s and Intel’s are the lowest. Suppose Intel posts a very good quarter and increases the stock prices by 20%, while Apple decreases by 10%.
Assuming all other company’s share prices remain the same, the combination of all the developments will lead to an overall decrease in the index due to the influence of Apple’s high share price compared to Intel. Hence, the Dow 30 is not a good indicator of representing how the markets are performing as a whole.
Another issue with the Dow 30 Index is that it focuses mainly on the industrial sector and ignores the utilities or real estate sectors. Also, big names like Alphabet, Amazon, and Facebook aren’t part of the index. A change in Amazon’s share price would mess up the Dow 30 formula.
Dow Futures
Dow Futures is a contract whose value is derived from the Dow 30. A futures contractFutures ContractA futures contract is an agreement to buy or sell an underlying asset at a later date for a predetermined price. It’s also known as a derivative because future contracts derive their value from an underlying asset. Investors may purchase the right to buy or sell the underlying asset at a later date for a predetermined price. is a contractual agreement to buy or sell a financial asset in the future at a predetermined price and time. Since the Dow Futures is based on the Dow 30, the contract is for the 30 stocks on the index.
The value of the Dow Futures is around 10 times that of the Dow 30. It means if the Dow 30 is trading at 10,000 points, the price for a buyer of one Dow Futures will be $100,000. Hence, it can be concluded that a 1-point change in the Dow 30 will lead to a $10 change in the Dow Futures contract. The seller benefits only when the Dow 30 decreases.
The Dow Futures is like a derivative where one party bets against the market and the other party bets for the market. Suppose the buyer of the Dow Futures contract predicts an increase in the Dow 30, while the seller predicts the opposite.
If one month down the line, the Dow 30 increases from 12,000 to 12,500, the buyer of the contract will get $5,000 [(12,500 – 12,000) * 10] in their account from the seller. If the Dow 30 decreases by 500 points, the seller will get $5,000 in their account from the buyer. Therefore, an investor could risk owing a lot of money by trading in the futures contract.
Additional Resources
CFI offers the Capital Markets & Securities Analyst (CMSA)™Program Page - CMSAEnroll in CFI's CMSA® program and become a certified Capital Markets &Securities Analyst. Advance your career with our certification programs and courses. certification program for those looking to take their careers to the next level. To keep learning and developing your knowledge base, please explore the additional relevant resources below:
- Capitalization-Weighted IndexCapitalization-Weighted IndexThe Capitalization-Weighted Index (cap-weighted index, CWI) is a type of stock market index in which each component of the index is weighted relative to its total market capitalization. In a capitalization-weighted index, companies with larger market capitalization exert a greater impact on the index value.
- How to Invest in the S&P 500 IndexHow to Invest in the S&P 500 IndexWe will discuss how portfolio managers and asset management companies invest in the S&P 500 Index. The S&P 500 Index itself is only a measure
- NASDAQ CompositeNASDAQ CompositeThe NASDAQ Composite is an index of more than 3,000 common equities listed on the NASDAQ stock market. The index is one of the most followed indices in the
- Russell 2000Russell 2000The Russell 2000 is a stock market index that tracks the performance of 2,000 US small-cap stocks from the Russell 3000 index.
-
K-Ratio Explained: Measuring Investment Growth & Consistency
The K-Ratio is a statistical tool that helps us measure two things – the growth of return and the consistency of that growth over a specified period. It is often used to determine the risk vs. r
-

Kelly Criterion: A Guide to Optimal Betting & Investment Strategy
Kelly criterion is a mathematical formula for bet sizing, which is frequently used by investors to decide how much money they should allocate to each investment or bet through a predetermined fraction
invest
- Understanding the Investment Accumulation Phase: Building Wealth Over Time
- Bandwagon Effect: Understanding Social Influence & Conformity
- Dogs of the Dow: A Dividend Stock Investing Strategy
- Understanding the Dow Divisor: How It Impacts the DJIA
- Dow Jones Industrial Average (DJIA): Definition & Significance
- Rule of 72: Calculate Investment Doubling Time | [Your Brand Name]
- Dogs of the Dow: A Simple & Potentially Profitable Investment Strategy
- S&P 500 ETF vs. Dow Jones ETF: Which is Right for You?
- Nifty 50: History, Significance & Key Stocks - A Comprehensive Guide
-
 Understanding the January Effect: Stock Market Trends & Causes
The January Effect is known to be a seasonal increase in stock prices throughout the month of January. The increase in demand for stocks is often preceded by a decrease in price during the month of De...
-
 Understanding the Joseph Effect: Trends vs. Randomness
The Joseph Effect, which derives its name from a Biblical reference, is a phrase created by Benoit Mandelbrot, a Polish-born French-American mathematician. The phrase asserts that variations over time...