Double Top Pattern: Definition, Trading Signals & Analysis
Common in financial trading, the double top is a type of chart pattern that can be found when performing technical analysisTechnical Analysis - A Beginner's GuideTechnical analysis is a form of investment valuation that analyses past prices to predict future price action. Technical analysts believe that the collective actions of all the participants in the market accurately reflect all relevant information, and therefore, continually assign a fair market value to securities.. The double top chart pattern is an indication that the prevailing trend may reverse in the short or long term. Financial trading markets include the trading of currencies, stocks, commodities, and other financial assets.
Summary
- The double top is a type of chart pattern that is an indication that the prevailing trend may reverse, in the short or long term.
- The double top is a common occurrence towards the end of a bullish market. The price formation looks like two peaks that occur after one another.
- The double bottom formation typically occurs at the end of a downward trending or declining market. The double bottom is similar to the double top, but the key difference between the two can be seen in the inverse or negative relationship in price.
The Double Top Confirmation
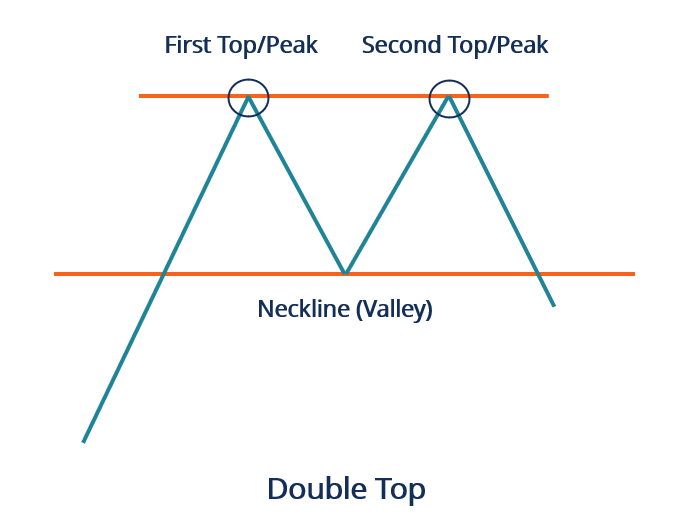
The double top is a common occurrence towards the end of a bullish marketBullish and BearishProfessionals in corporate finance regularly refer to markets as being bullish and bearish based on positive or negative price movements. A bear market is typically considered to exist when there has been a price decline of 20% or more from the peak, and a bull market is considered to be a 20% recovery from a market bottom.. The price formation looks like two peaks that occur after one another. The peaks are generally the same price on a price-vs-time chart. The peaks include a separation or parting, which is the minimum price.
The parting or separation is also known as a valley. The price level at the valley is known as a neckline of the price formation. In the instance where the price drops below the neckline, the price formation is considered to be confirmed and complete. It serves as an indicator that the price is likely to continue to fall or that a continued price drop is looming.
The double top pattern tells an investor, trader, or analyst that the buyers in the market are prevailing, and as such, the demand is overtaking the supply up until the formation of the first top. It causes prices to rise. The trend is then reversed, and the sellers in the market begin to prevail, subsequently with the supply overtaking the demand. As the supply surpasses demand, the prices begin to fall. It creates the neckline or the price valley. Following the valley, the bulls or buyers in the market begin to dominate again, and prices begin to rise.
When the traders notice that the prices are not rising beyond the level reached by the first top, the bears or sellers may then begin to dominate, and it begins to lower price levels. It causes the formation of a double top. Should the prices drop beyond the valley, it is generally a bearish signal.
Two factors that allow for analysts or traders to determine the existence of the double top pattern are volumeVolume of TradeVolume of trade, also known as trading volume, refers to the quantity of shares or contracts that belong to a given security traded on a daily basis and the time between the peaks. When looking at the volume, it is beneficial to note that the buildup of the price level reached on the first peak can be attributed to increased volume. The fall to the neckline occurring thereafter can be attributed to low volumes. The second attempt leading towards the second peak should also be on low volume levels.
When looking at the time between the two tops to determine whether or not a double top pattern is present, it is beneficial to note that when the peaks reach the same price levels in very close time periods, they are to indicate that the trend will resume and that they form part of the consolidation.
Drawbacks of the Double Top
As with all other chart patterns, the double top pattern is not to be used on its own. Although the formation may provide an overview of what is happening between the bulls and the bears, analysts and tradersSix Essential Skills of Master TradersJust about anyone can become a trader, but to be one of the master traders takes more than investment capital and a three-piece suit. Keep in mind: there is a sea of individuals looking to join the ranks of master traders and bring home the kind of money that goes with that title. need to be precautious when identifying the price formation and ensuring its legitimacy before making a trade.
The Double Bottom
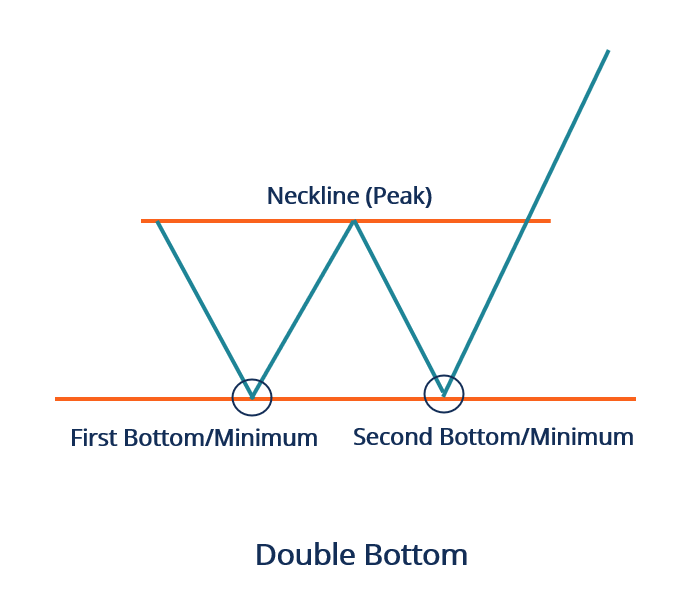
The double bottom formation typically occurs at the end of a downward trending or declining market. The double bottom is similar to the double top, but the key difference between the two can be seen in the inverse or negative relationship in price.
In contrast to the double top, the double bottom price formation comprises two peaks or prices occurring at a similar minimum level and are separated by a peak known as the neckline. When prices rise above the neckline, it serves as a confirmation of the price formation and may signal that prices will likely continue to rise.
As with the double top, timing and volume also play a role in the analysis and confirmation of the double bottom.
More Resources
CFI is the official provider of the global Commercial Banking & Credit Analyst (CBCA)™Program Page - CBCAGet CFI's CBCA™ certification and become a Commercial Banking & Credit Analyst. Enroll and advance your career with our certification programs and courses. certification program, designed to help anyone become a world-class financial analyst. To keep advancing your career, the additional resources below will be useful:
- Advanced Technical AnalysisAdvanced Technical AnalysisAdvanced technical analysis usually involves using either multiple technical indicators or a rather sophisticated (i.e., complex) indicator. "Sophisticated"
- Bull vs BearBull vs BearThe term bull vs. bear denotes the ensuing trends in stock markets – whether they are appreciating or depreciating in value – and what is the
- Martingale StrategyMartingale StrategyThe Martingale Strategy involves doubling the trade size every time a loss is faced. A classic scenario for the strategy is to try and trade
- Momentum IndicatorsMomentum IndicatorsMomentum indicators are tools utilized by traders to get a better understanding of the speed or rate at which the price of a security changes. Momentum
-

Understanding Divergence in Technical Analysis: A Guide
Divergence is when the asset price moves in the direction opposite to what a technical indicator indicates. When a stock is diverging, it signals weaker price trends and the beginning of a reversal.&n
-
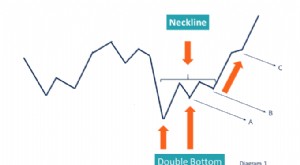
Double Bottom Pattern: Technical Analysis Explained
A double bottom is a type of price movement identified in technical analysis where there is a fall in price led by gain and then another drop (similar to the previous drop), and finally, a rise in pri
invest
- Tone at the Top: Defining Leadership & Ethical Corporate Culture
- Black-Scholes Model: Understanding Stock Option Pricing
- Understanding the Forward Curve: A Comprehensive Guide
- Understanding the Heath-Jarrow-Morton (HJM) Interest Rate Model
- Heston Model: Understanding Volatility in Financial Options
- Understanding Market Support: What is 'Holding the Market'?
- Understanding Offering Price: A Guide for Investors
- Understanding Quoted Prices: A Comprehensive Guide
- Spinning Top Candlestick Pattern: Meaning & Trading Signals
-
 Understanding Dead Cat bounces: A Stock Market Indicator
The dead cat bounce describes a financial phenomenon whereby a stock in a steady decline suddenly, and without a logical cause, gains value temporarily before continuing its downward trend. The term o...
-
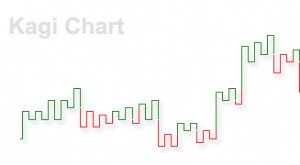 Kagi Chart Explained: A Clearer View of Price Action
The Kagi chart is a type of chart that shows the price movements of an asset. Different from a candlestick chart or other conventional types of charts, a Kagi chart does not contain a time axis, which...