Understanding Head-Fake Trades in Finance: A Complete Guide
A head-fake trade occurs when the price of a security or other traded financial asset moves in a specific direction and then quickly reverses to follow the opposite direction. The term “head-fake” is common in sports (particularly football and basketball) and derived from a tactic used by teams in sports to confuse opposing teams by making them believe that players are moving in a particular direction but then take on another direction.
Head-fake trades tend to occur at break-out points – such as support and resistance levels – and the break-out points can be monitored in conjunction with simple moving averagesSimple Moving Average (SMA)Simple Moving Average (SMA) refers to a stock's average closing price over a specified period. The reason the average is called "moving" is that the stock.

Understanding Head-Fake Trades
Consider a scenario where the economy and overall market see a decline in performance, but there is an asset that is trading at high price points. Traders who are interested in selling off the traded asset will vigilantly monitor the changes in the price of the asset and try to identify potential break-out points and measure whether the increment will break down.
If the price increment of the traded asset begins to slow down or notably decrease, players in the market may follow the assumption that the asset’s price has begun declining and rush to sell off the asset; however, if the price direction reverses – i.e., begins to rise again – the scenario would be considered a head-fake trade.
There are a few people who aim to generate profits from head-fake trades. Such contrarians tend to buy a financial asset or stock when other market players are looking to sell or vice-versa. Hence, they do not follow universal market opinions. Losses can be incurred due to head-fake trades; thus, traders should always set up and adhere to stop-loss limitsStop-Loss OrderA stop-loss order is a tool used by traders and investors to limit losses and reduce risk exposure. Learn more about stop-loss orders in this article. to minimize their risk exposure.
Summary
- A head-fake trade occurs when the price of a security or other treaded financial asset moves in a specific direction and then reverses and follows an opposite direction.
- Head-fake trades tend to occur at break-out points – such as support and resistance levels – and these break-out points can be monitored in conjunction with simple moving averages.
- Losses can be incurred due to head-fake trades; hence, traders should always set up and adhere to stop-loss limits to minimize their risk exposure.
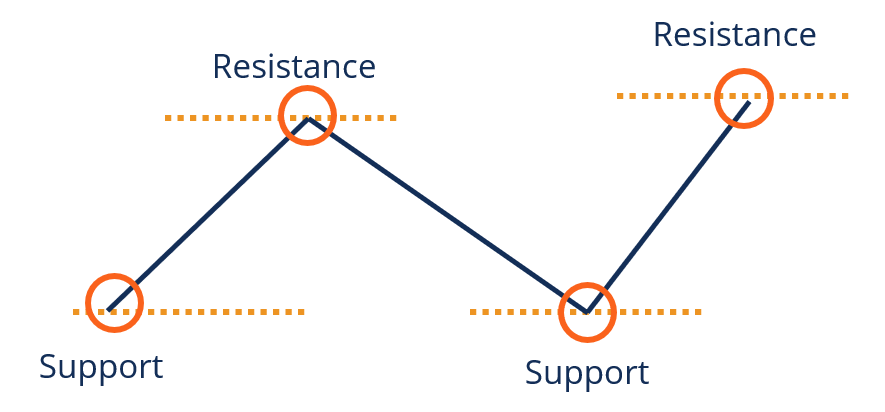
Support and Resistance Levels and Simple Moving Average
Financial traders use support and resistance levels to analyze and identify chart patterns in the market.
A support level occurs at a price level where a downward trend comes to a halt due to a rise in demand from the buyers in a market. The support level is said to support the price of a trade financial asset and prevents prices from dropping further below the support level.
A resistance level occurs at a price level where an upward trend comes to a halt due to an increase in supply from sellers in a market. The resistance level is said to give resistance to the price of a trade financial asset and prevents prices from moving up above the resistance level.
The simple moving average (SMA) is an arithmetic computation of the average of a range of values (usually prices) by adding the most recent values together and dividing the sum figure by the number of periods in the range.
Real-World Example of Head-Fake Trading
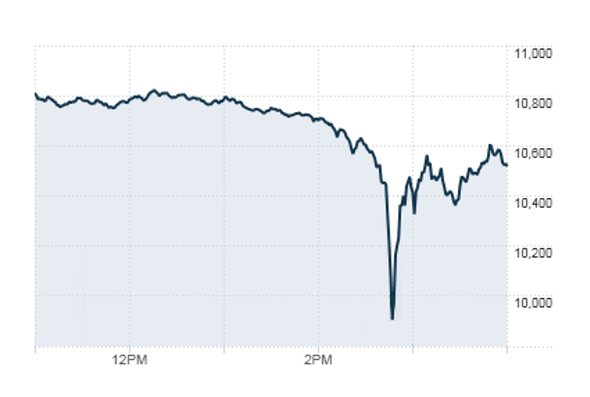
In 2010, the crash of 2:45 (also known as the flash crash) occurred and resulted in losses that amounted to trillions of dollars. The stock market crash lasted 36 minutes.
During the flash crash, stock index prices fell considerably and then rose again in a matter of minutes. The market was able to regain losses incurred as prices recovered. The indices impacted include the NASDAQ Composite, the S&P 500S&P 500 IndexThe Standard and Poor’s 500 Index, abbreviated as S&P 500 index, is an index comprising the stocks of 500 publicly traded companies in the, and the Dow Jones Industrial Average.
The prices of various traded assets were highly volatile during the crash, which brought about an increase in trading volumes. Traders who took sell positions, following the assumption that the short-term downward trend would persist, incurred losses as the price direction changed and prices began to increase.
The image below shows a snapshot of the Dow Jones Industrial Average (DJIA)Dow Jones Industrial Average (DJIA)The Dow Jones Industrial Average (DJIA), also referred to as "Dow Jones” or "the Dow", is one of the most widely-recognized stock market indices. on May 6, 2010.
More Resources
CFI is the official provider of the Capital Markets & Securities Analyst (CMSA)™Program Page - CMSAEnroll in CFI's CMSA® program and become a certified Capital Markets &Securities Analyst. Advance your career with our certification programs and courses. certification program, designed to transform anyone into a world-class financial analyst.
In order to help you become a world-class financial analyst and advance your career to your fullest potential, these additional resources will be very helpful:
- 2010 Flash Crash2010 Flash CrashThe 2010 Flash Crash is the market crash that occurred on May 6, 2010. During the 2010 crash, leading US stock indices, including the Dow
- Forecasting MethodsForecasting MethodsTop Forecasting Methods. In this article, we will explain four types of revenue forecasting methods that financial analysts use to predict future revenues.
- NASDAQ CompositeNASDAQ CompositeThe NASDAQ Composite is an index of more than 3,000 common equities listed on the NASDAQ stock market. The index is one of the most followed indices in the
- How to Read Stock ChartsHow to Read Stock ChartsIf you’re going to actively trade stocks as a stock market investor, then you need to know how to read stock charts. Even traders who primarily use fundamental analysis to select stocks to invest in still often use technical analysis of stock price movement to determine specific buy and sell, stock charting
-

Commodity Valuation: Understanding Intrinsic Value & Market Pricing
Commodity valuation is the process of deriving the intrinsic value of a commodity under optimal market conditions. In a perfectly competitive free market, the price of a commodity reflects the intrins
-
Covered Calls: A Comprehensive Guide for Investors
A covered call is a risk management and an options strategy that involves holding a long position in the underlying asset (e.g., stockStockWhat is a stock? An individual who owns stock in a company is
invest
- Inflation Trade: Strategies & Investing in Rising Prices
- Understanding Divergence in Technical Analysis: A Guide
- Understanding Forward Prices: Definition & How They Work
- FX Carry Trade: Strategy, Risks & How It Works
- Understanding Hedging Strategies: A Comprehensive Guide
- Understanding Slippage in Trading: Causes & Impact
- Understanding Strangle Options: A Comprehensive Guide
- Understanding Trade Orders: A Comprehensive Guide
- Understanding Volatility: A Key Indicator of Investment Risk
-
 Understanding Call Prices: Callable Bonds & Preferred Stocks
A call price refers to the price that a preferred stock or bond issuer would pay to buyers if they chose to redeem the callable security before the maturity date. The price is set during the issuance ...
-
 Call Warrants: Understanding Rights & Investment Potential
A call warrant gives the holder of the investment the right, not the obligation, to purchase the underlying financial securities at a specific price on or before a certain date.If the holder does not ...