Understanding Divergence in Technical Analysis: A Guide
Divergence is when the asset price moves in the direction opposite to what a technical indicator indicates. When a stock is diverging, it signals weaker price trends and the beginning of a reversal.

The two types of divergence are:
- Positive: A positive divergence is a sign of higher price movement in the asset.
- Negative: A negative divergence signals that the asset price may move lower.
Summary
- Divergence compares the patterns between the price of an asset and a technical indicator. It is most apparent when the asset price is moving in the opposite direction of what the technical indicator states.
- Positive divergence signals potential positive uptrend in price momentum, which can be bullish. Negative divergence signals potential slowdowns and an increase in downtrends in price momentum, which can be bearish.
- As divergence is present in only some price reversals, it should not be the sole tool in making trading decisions – it is important to use a collection of tools to substantiate one’s decision.
Divergence During Technical Analysis
During technical analysisTechnical Analysis - A Beginner's GuideTechnical analysis is a form of investment valuation that analyses past prices to predict future price action. Technical analysts believe that the collective actions of all the participants in the market accurately reflect all relevant information, and therefore, continually assign a fair market value to securities., divergence is an indicator of positive or negative price movement. For a positive divergence, the price of an asset will dip to a new low, while the indicator that tracks this asset will indicate patterns of climbing.
On the other hand, a negative divergence is when the price of the asset climbs to a new high, while the indicator, such as an oscillator, forms a lower high or begins to show signs of slowing down, such as the beginning of a downtrend.
Generally, traders use divergence for two purposes:
- Assessing the momentum of the asset price
- Assessing the likelihood that a reversal would occur
If the stock price and technical analysis tool – such as the Relative Strength Index (RSI)Relative Strength Index (RSI)The Relative Strength Index (RSI) is one of the most popular and widely used momentum oscillators. It was originally developed by the famed mechanical engineer turned technical analyst, J. Welles Wilder. The RSI measures both the speed and rate of change in price – are moving in the same direction, it indicates an increase in momentum. However, if the stock price is increasing but the RSI is increasing more slowly – negative divergence – it is a signal that the uptrend is beginning to weaken, along with the potential of a reversal.
From then on, the trader would likely determine when to set stop losses or limits in order to exit their position. For a positive divergence, the stock price would make lows, while the technical analysis tool would indicate even larger lows, which may show signs of a potential uptrend reversal. From such a point, tradersSix Essential Skills of Master TradersJust about anyone can become a trader, but to be one of the master traders takes more than investment capital and a three-piece suit. Keep in mind: there is a sea of individuals looking to join the ranks of master traders and bring home the kind of money that goes with that title. would likely decide when to enter into a position before momentum begins to pick up.
What is Price Momentum?
Price momentum is measured by the length of price swings. Each price swing is established by a pivot, which can result in either high or low swings. A strong momentum swing is characterized by a steep slope with a long duration, whereas a weak momentum upwards swing can be illustrated by a shallow slope with a shorter duration.
Longer upward swings indicate that momentum is rising, while shorter upward swings signal weaker momentum and strength.
Types of Momentum Indicators
Common momentum indicators include:
- Relative Strength Index (RSI)
- StochasticsStochastic OscillatorThe Stochastic Oscillator is an indicator that compares the most recent closing price of a security to the highest and lowest prices during a specified period of time. It gives readings that move back and forth between zero and 100 to provide an indication of the security's momentum.
- Rate of Change (ROC)
Divergence vs. Confirmation
The difference between divergence and confirmation is that divergence tells the trader when the stock price and technical indicator are providing opposite signals, while confirmation is when the indicator and asset price are displaying the same signals.
Both are used during different periods of time during trading. Confirmation is important when a trader enters a position to reassure that their decision is substantiated by the appropriate technical analysis. Also, it is used to determine whether the price movement would likely continue or not.
Limitations of Divergence
When determining a trend reversal, using divergence as a standalone indicator is not suggested. It is important to complement the indicators with other analysis techniques to reaffirm the patterns of a reversal. Even if diverging patterns begin to occur, it does not guarantee that the price will reverse any time soon.
As divergence can happen over an extensive period of time, using it as a standalone tool to predict an exit or entry position can result in many lost opportunities and unrealized or realized losses if the asset price does not move as predicted.
Other Tools to Use with Divergence
Beyond divergence, to help make trading decisions, the following should be used to confirm a reversal:
- Trendlines
- Support levels
- Resistance levels
More Resources
CFI offers the Commercial Banking & Credit Analyst (CBCA)™Program Page - CBCAGet CFI's CBCA™ certification and become a Commercial Banking & Credit Analyst. Enroll and advance your career with our certification programs and courses. certification program for those looking to take their careers to the next level. To keep learning and developing your knowledge base, please explore the additional relevant resources below:
- Advanced Technical AnalysisAdvanced Technical AnalysisAdvanced technical analysis usually involves using either multiple technical indicators or a rather sophisticated (i.e., complex) indicator. "Sophisticated"
- Momentum IndicatorsMomentum IndicatorsMomentum indicators are tools utilized by traders to get a better understanding of the speed or rate at which the price of a security changes. Momentum
- ARMS IndexArms Index (TRIN)The Arms Index, also known as the Short-Term Trading Index (TRIN), refers to a short-term technical analysis trading indicator that compares the number of
- Speed LinesSpeed Lines - Technical AnalysisSpeed lines are an analysis tool used to determine support and resistance levels. They are not intended to be used as a standalone technical indicator.
-
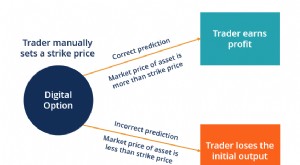
Understanding Digital Options: A Comprehensive Guide for Traders
A digital option is a form of option that allows traders to manually set a strike price. The digital option provides the traders with a fixed payout in the case when the market price of the underlying
-
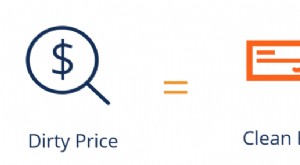
Understanding Dirty Price: Bond Pricing Explained
Dirty price is when a bond price includes interest that has accrued since the latest coupon payment. When investors buy fixed-income securities, such as bondsBonds vs StocksFor prospective
invest
- Understanding Forward Prices: Definition & How They Work
- Understanding Hedging Strategies: A Comprehensive Guide
- Understanding Slippage in Trading: Causes & Impact
- Understanding Strangle Options: A Comprehensive Guide
- Understanding Volatility: A Key Indicator of Investment Risk
- Price Discrimination Explained: Types, Examples & Strategies
- What is Price Fixing?
- Price Skimming: Definition, Strategy & When to Use It
- Understanding Clearing Prices in Stock Trading: A Comprehensive Guide
-
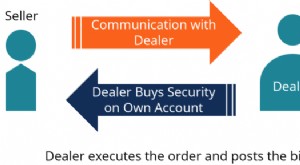 Understanding Dealer Markets: How Market Makers Function
A dealer market is a financial market where dealers post prices they would be willing to buy and sell specific securitiesTrading SecuritiesTrading securities are securities purchased by a company for ...
-
 Understanding Delta: A Key Risk Measure in Derivatives
Delta is a risk sensitivity measure used in assessing derivativesDerivativesDerivatives are financial contracts whose value is linked to the value of an underlying asset. They are complex financial in...