Darvas Box Strategy: A Beginner's Guide to Profitable Trading
The Darvas Box Theory was a trading strategy that was invented by self-taught investor Nicolas Darvas, who used to target stocks with pricing and volume as indicators. It makes the Darvas Box Theory similar to technical analysisTechnical Analysis - A Beginner's GuideTechnical analysis is a form of investment valuation that analyses past prices to predict future price action. Technical analysts believe that the collective actions of all the participants in the market accurately reflect all relevant information, and therefore, continually assign a fair market value to securities., which is a trading discipline that is applied by security traders who observe patterns within historical trading data and attempt to analyze securities with the underlying trading data.
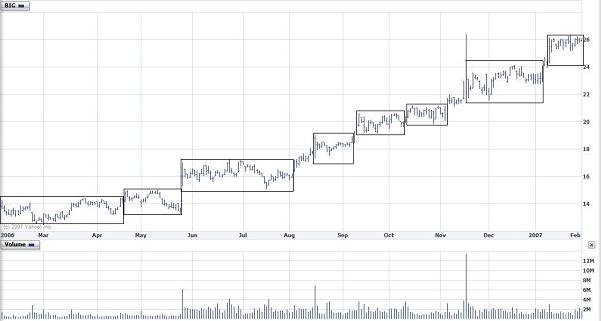
The Darvas Box trading strategy involves buying stocks that are trading at new highs of prices and drawing a box around the prices’ recent highs and lows to establish an entry point and an exit point for a stop-loss orderStop-Loss OrderA stop-loss order is a tool used by traders and investors to limit losses and reduce risk exposure. Learn more about stop-loss orders in this article..
Stocks are considered to be trading within a Darvas Box when the price rises above the previous high but subsequently retracts to a price that is relatively close to the high.
Understanding the Darvas Box Theory
Origin
Nicolas Darvas was traveling the world as a ballroom dancer in the 1950s when he obtained subscriptions to The Wall Street Journal and Barron’s and only used the listed stock prices to determine what stocks he would invest in.
Darvas would draw boxes and follow trading rules to turn a $10,000 initial investment into $2,000,000. His success led to a book that he wrote called How I Made $2,000,000 in the Stock Market and made the Darvas Box Theory very popular.
The Darvas Box Theory is applied today through technical analysis. Technical analysis utilizes boxes or other technical tools that follow underlying principles, such as support, resistance bands, and momentumMomentumMomentum is the observation that financial assets trending strongly in a certain direction will continue to move in that direction. The concept of momentum. Darvas applied his strategy when the flow of information was much slower, and technical charting was impossible. The same principles Darvas used could be applied with technical charting.
How It Works
The Darvas Box Theory is a trading strategy that follows the momentum of stocks. The momentum theory simply states that stock prices that increased previously are more likely to increase in the future. Conversely, stock prices that were decreasing previously are more likely to decrease in the future.
The theory gave insight on when to enter and exit certain positions by drawing boxes around the highs and lows over time. It instructs practitioners to only take long positions in rising boxes and use the highs of those boxes to set exit points. So that if a stock price fell below that exit point, the stock should be sold.
The Darvas Box Theory appears to be a purely technical trading strategy – which is a strategy that only uses pricing and volume information to inform investment decisions. Darvas did use fundamental analysisFundamental AnalysisIn accounting and finance, fundamental analysis is a method of assessing the intrinsic value of a security by analyzing various macroeconomic and microeconomic factors. The ultimate goal of fundamental analysis is to quantify the intrinsic value of a security. as well to determine which stocks to target.
Fundamental analysis includes observing qualitative and quantitative factors of individual investments to inform investment decisions. Darvas would target sectors or industries that offered high excitement potential for investors and consumers and were creating revolutionary products. Darvas would also screen for companies that maintained healthy earnings growth over time as well.
Insights from the Darvas Box Theory
Although the Darvas Box Theory at its time was very successful, it likely would not be as effective in the modern investing world. The information efficiency today is far greater than when Darvas experienced his success. Despite the fact, some key insights can be derived from the theory, namely:
- Focusing on growth industries
- Investing in high-volume securities
- Use of stop-loss orders
Darvas encouraged investors to focus on stocks with high volume since it was an indicator that a stock was making strong moves. Such a practice may be limited today since a lot of trading volume is created by algorithmic, non-human traders.
He used stop-loss orders to minimize losses and take gains off the table from positions. A stop-loss order is a free order instruction that instructs a broker to sell a position after it falls below a certain point. It can help to limit losses in positions and set a free insurance policy.
Additional Resources
CFI offers the Commercial Banking & Credit Analyst (CBCA)™Program Page - CBCAGet CFI's CBCA™ certification and become a Commercial Banking & Credit Analyst. Enroll and advance your career with our certification programs and courses. certification program for those looking to take their careers to the next level. To keep learning and advancing your career, the following resources will be helpful:
- Algorithm TradingAlgorithmic TradingAlgorithmic trading strategies involve making trading decisions based on pre-set rules that are programmed into a computer.
- Defensive StockDefensive StockA defensive stock is a stock that demonstrates relatively stable performance regardless of the current state of the economy. They are also
- Momentum IndicatorsMomentum IndicatorsMomentum indicators are tools utilized by traders to get a better understanding of the speed or rate at which the price of a security changes. Momentum
- Trade OrderTrade OrderPlacing a trade order seems intuitive – a “buy” button to initiate a trade and a “sell” button to close a trade.
-

Understanding the Call Market: Trading Hours & Price Determination
The call market refers to a market where trading does not take place continuously, but only at specified times during the trading day. Prices are dictated by the exchange rather than by bids and offer
-
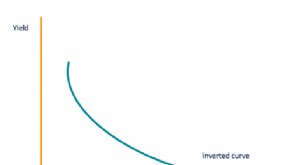
Understanding the Credit Curve: A Guide for Investors
The credit curve is the graphical representation of the relationship between the return offered by a security (credit-generating instrument) and the time to maturity of the security. It measures the i
invest
- Box Spread Options Strategy: Definition & How It Works
- Dow 30 Explained: Understanding the Dow Jones Industrial Average
- Elliott Wave Theory: A Comprehensive Guide for Traders
- Understanding the Greater Fool Theory: Market Valuation & Irrational Exuberance
- Local Expectations Theory: Understanding Bond Yields & Term Structure
- Preferred Habitat Theory in Bond Markets: An Explanation
- Random Walk Theory Explained: Understanding Market Price Movements
- Segmented Markets Theory: Understanding Bond Term Structure
- Understanding the Liquidity Preference Theory: A Comprehensive Explanation
-
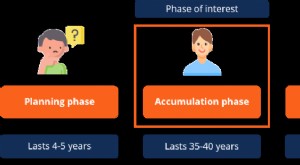 Understanding the Investment Accumulation Phase: Building Wealth Over Time
The accumulation phase refers to the time in the life cycle of an investment when an individual or an investor builds up the value of their annuity or investment. It is the second phase in the process...
-
 Bandwagon Effect: Understanding Social Influence & Conformity
The bandwagon effect is the tendency of people to take certain actions or arrive at a conclusion primarily because other people are doing so. The phenomenon is observed in various fields, such as econ...