Treynor Ratio: Understanding Risk-Adjusted Portfolio Performance
The Treynor Ratio is a portfolio performance measure that adjusts for systematic riskSystematic RiskSystematic risk is that part of the total risk that is caused by factors beyond the control of a specific company or individual. Systematic risk is caused by factors that are external to the organization. All investments or securities are subject to systematic risk and therefore, it is a non-diversifiable risk.. In contrast to the Sharpe RatioSharpe RatioThe Sharpe Ratio is a measure of risk-adjusted return, which compares an investment's excess return to its standard deviation of returns. The Sharpe Ratio is commonly used to gauge the performance of an investment by adjusting for its risk., which adjusts return with the standard deviation of the portfolio, the Treynor Ratio uses the Portfolio Beta, which is a measure of systematic risk.
These ratios are concerned with the risk and returnRisk and ReturnIn investing, risk and return are highly correlated. Increased potential returns on investment usually go hand-in-hand with increased risk. Different types of risks include project-specific risk, industry-specific risk, competitive risk, international risk, and market risk. performance of a portfolio and are a quotient of return divided by risk. The Treynor Ratio is named for Jack Treynor, an American economist known as one of the developers of the Capital Asset Pricing Model.
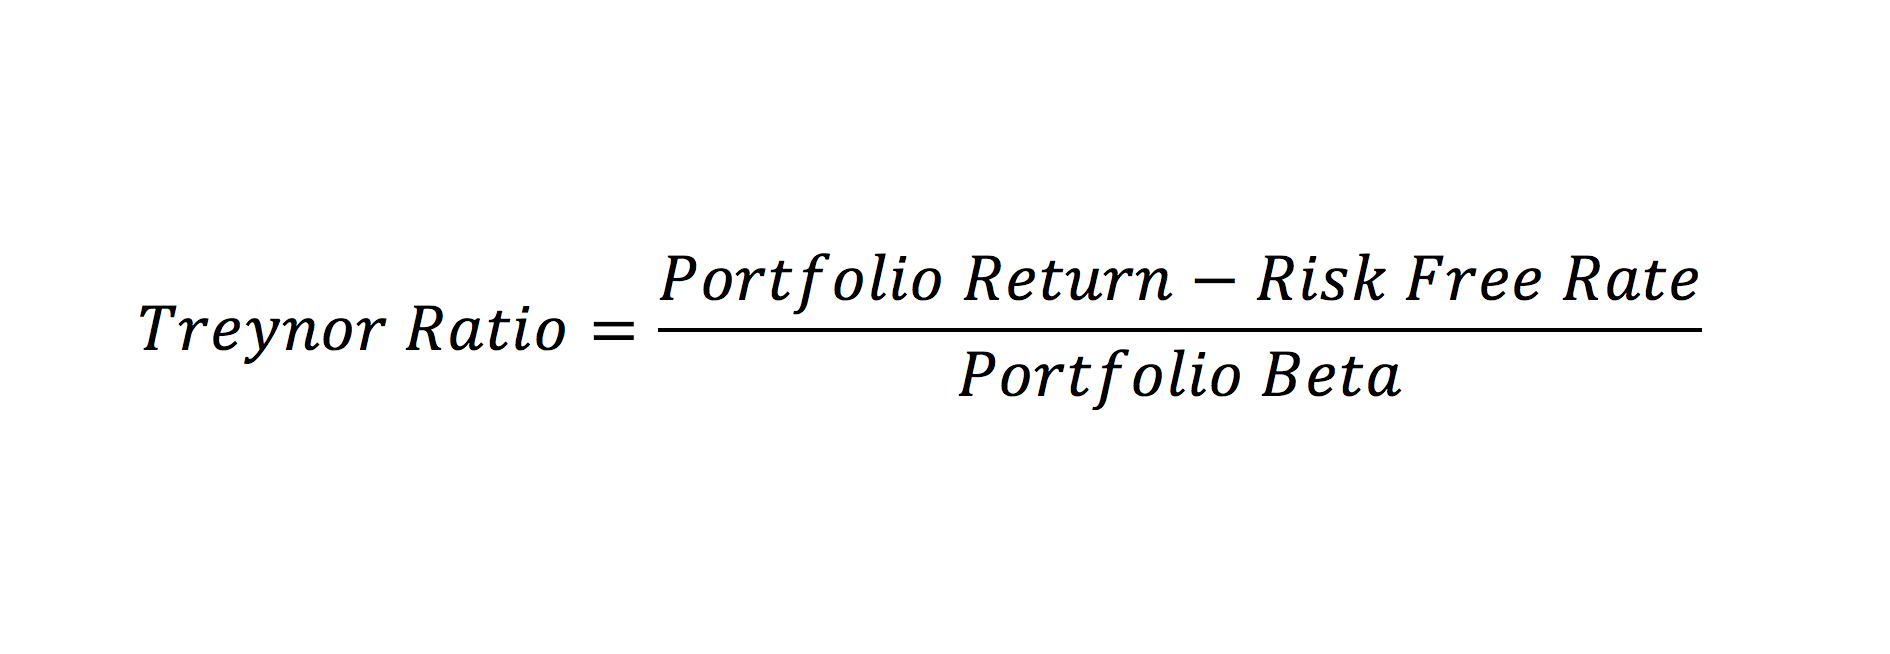
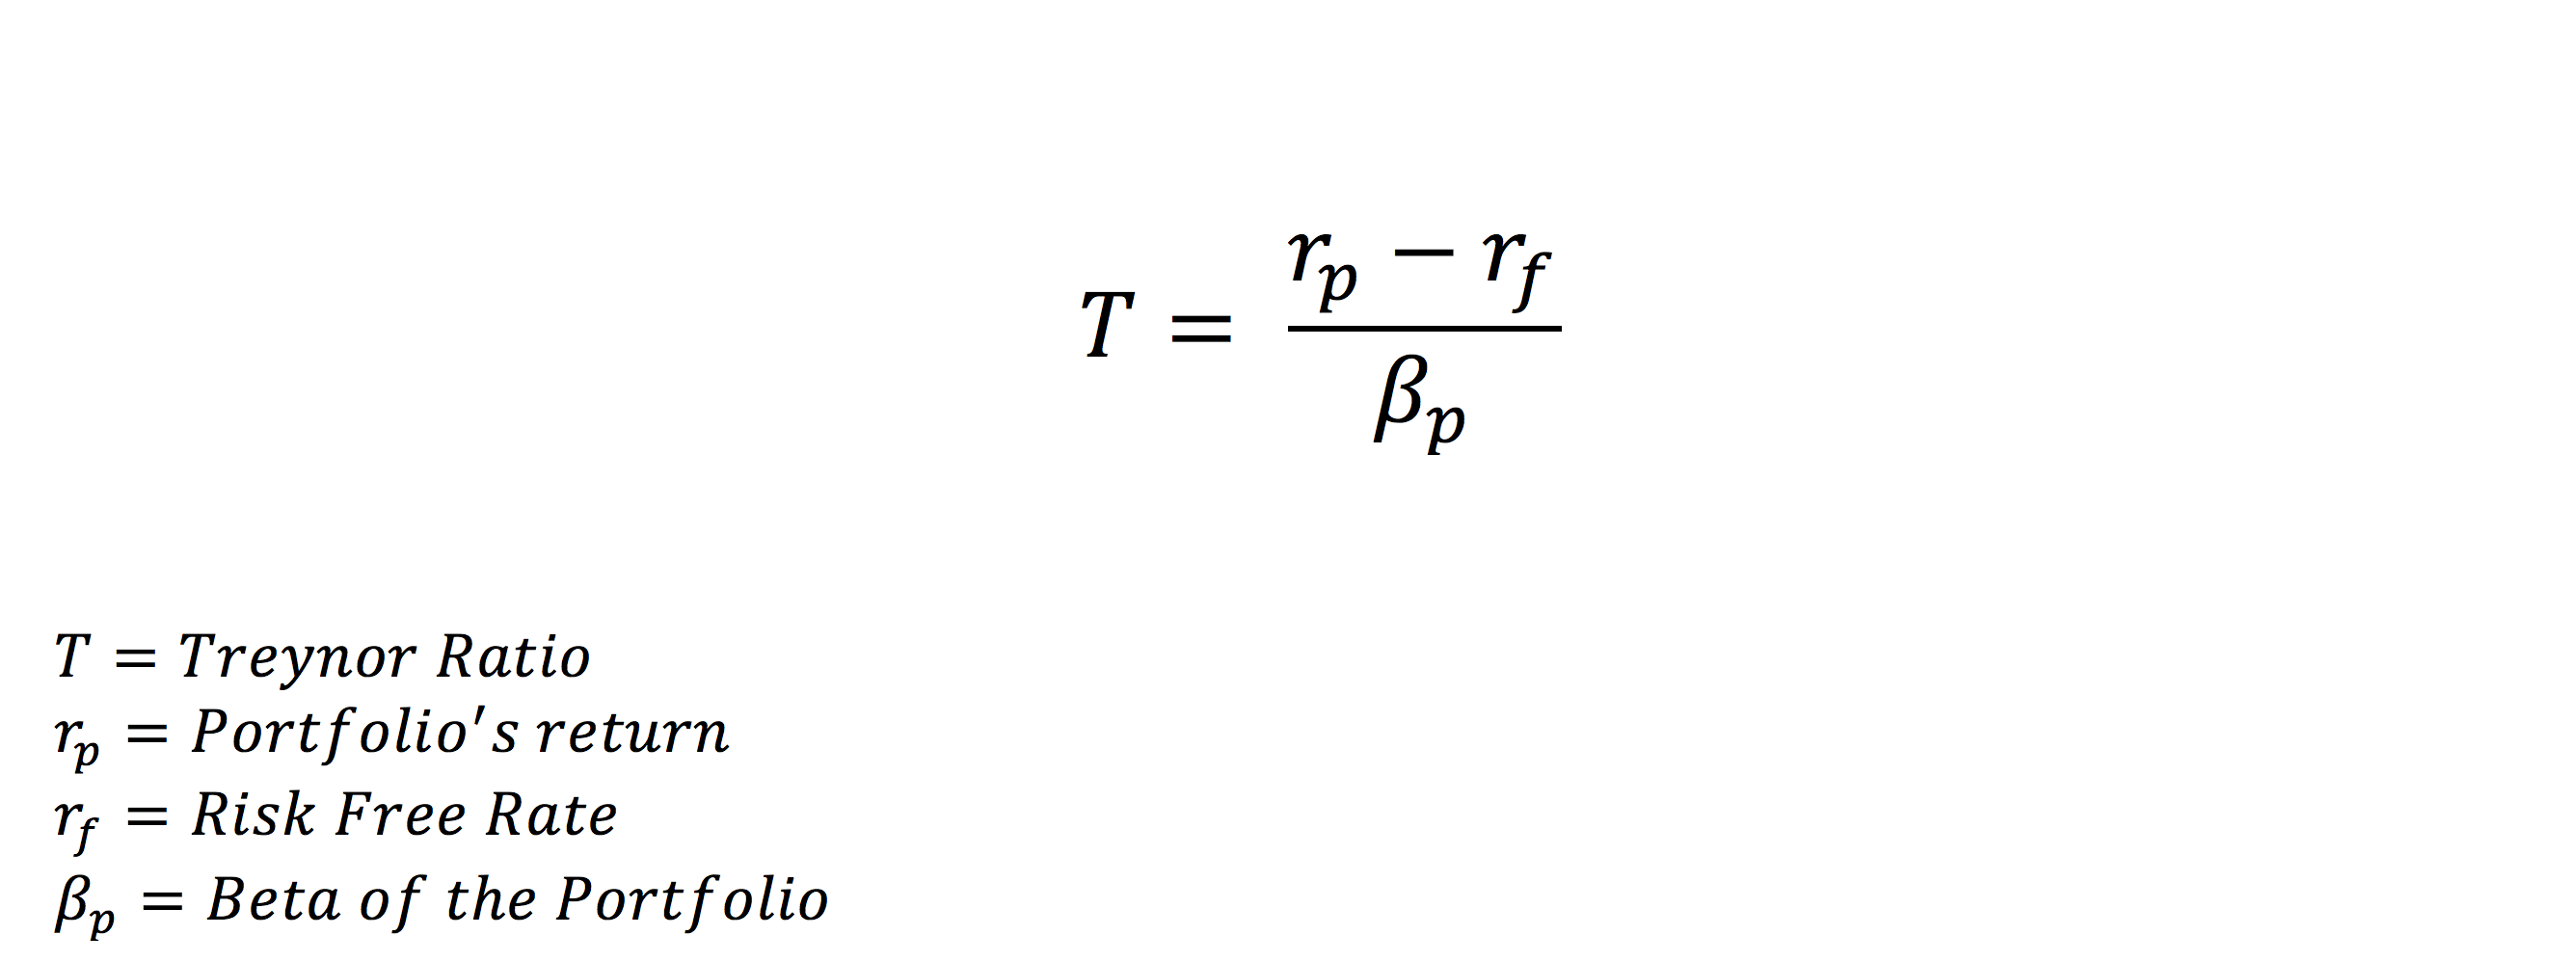
Treynor Ratio Formula
From the formula below, you can see that the ratio is concerned with both the return of the portfolio and its systematic risk. From a purely mathematical perspective, the formula represents the amount of excess return from the risk-free rate per unit of systematic risk. Like the Sharpe Ratio, it is a Return/Risk Ratio.
The Treynor Ratio measures portfolio performance and is part of the Capital Asset Pricing Model. To read more about how to calculate Beta,BetaThe beta (β) of an investment security (i.e. a stock) is a measurement of its volatility of returns relative to the entire market. It is used as a measure of risk and is an integral part of the Capital Asset Pricing Model (CAPM). A company with a higher beta has greater risk and also greater expected returns. click hereBeta CalculatorThis beta calculator allows you to measure the volatility of returns of an individual stock relative to the entire market. The beta (β) of an investment security (i.e. a stock) is a measurement of its volatility of returns relative to the entire market. It is used as a measure of risk and is an integral part of the Cap.
Treynor Ratio Example
Suppose you are comparing two portfolios, an Equity Portfolio and a Fixed Income Portfolio. You’ve done extensive research on both portfolios and can’t decide which one is a better investment. You decide to use the Treynor Ratio to help you select the best portfolio investment.
The Equity Portfolio’s total return is 7%, and the Fixed Income Portfolio’s total return is 5%. As a proxy for the risk-free rate, we use the return on U.S Treasury Bills – 2%. Assume that the Beta of the Equity Portfolio is 1.25, and the Fixed Income Portfolio’s Beta is 0.7. From the following information, we compute the Treynor Ratio of each portfolio.
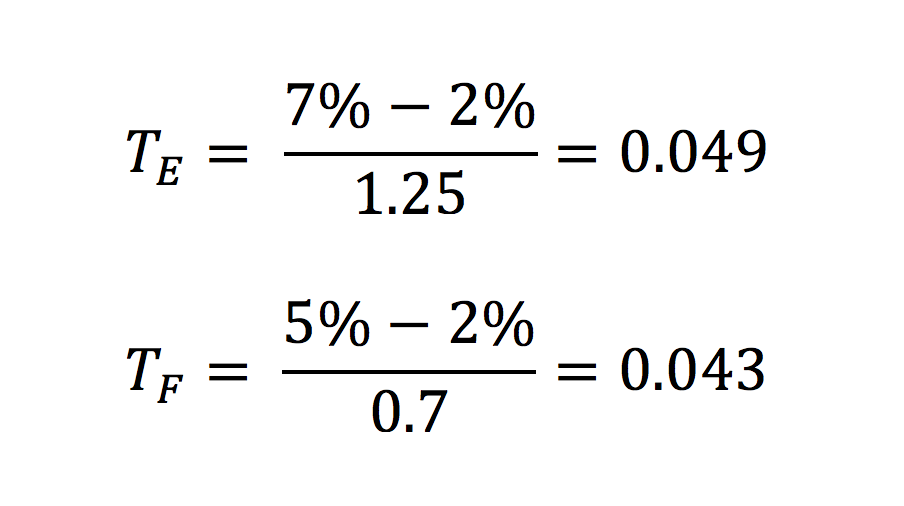
From the results above, we see that the Treynor Ratio of the Equity Portfolio is slightly higher. Thus, we can deduce that it is a more suitable portfolio to invest in. A higher ratio indicates a more favorable risk/return scenario. Keep in mind that Treynor Ratio values are based on past performance that may not be repeated in future performance.
As a financial analyst, it is important to not rely on a single ratio for your investment decisions. Other financial metrics should be considered before making a final decision.
When using the Treynor Ratio, keep in mind:
- For negative values of Beta, the Ratio does not give meaningful values.
- When comparing two portfolios, the Ratio does not indicate the significance of the difference of the values, as they are ordinal. For example, a Treynor Ratio of 0.5 is better than one of 0.25, but not necessarily twice as good.
- The numerator is the excess return to the risk-free rate. The denominator is the Beta of the portfolio, or, in other words, a measure of its systematic risk.
More Resources
CFI offers the Financial Modeling & Valuation Analyst (FMVA)™Become a Certified Financial Modeling & Valuation Analyst (FMVA)®CFI's Financial Modeling and Valuation Analyst (FMVA)® certification will help you gain the confidence you need in your finance career. Enroll today! certification program for those looking to take their careers to the next level. To keep learning and advancing your career, the following CFI resources will be helpful:
- Capital Asset Pricing Model (CAPM)Capital Asset Pricing Model (CAPM)The Capital Asset Pricing Model (CAPM) is a model that describes the relationship between expected return and risk of a security. CAPM formula shows the return of a security is equal to the risk-free return plus a risk premium, based on the beta of that security
- Internal Rate of Return (IRR)Internal Rate of Return (IRR)The Internal Rate of Return (IRR) is the discount rate that makes the net present value (NPV) of a project zero. In other words, it is the expected compound annual rate of return that will be earned on a project or investment.
- Treasury Bills (T-Bills)Treasury Bills (T-Bills)Treasury Bills (or T-Bills for short) are a short-term financial instrument issued by the US Treasury with maturity periods from a few days up to 52 weeks.
- Financial Modeling GuideFree Financial Modeling GuideThis financial modeling guide covers Excel tips and best practices on assumptions, drivers, forecasting, linking the three statements, DCF analysis, more
-

Asset Turnover Ratio: Definition & Calculation - Financial Analysis
The asset turnover ratio, also known as the total asset turnover ratio, measures the efficiency with which a company uses its assets to produce salesSales RevenueSales revenue is the income recei
-
Benefit-Cost Ratio (BCR): Understanding & Calculation
The benefit-cost ratio (BCR) is a profitability indicator used in cost-benefit analysis to determine the viability of cash flows generated from an asset or project. The BCR compares the present value
finance
- Acid-Test Ratio: Understanding Your Company's Short-Term Liquidity
- Advertising to Sales Ratio: Measuring Ad Effectiveness & ROI
- Understanding the CAPE Ratio: A Guide to Cyclically Adjusted P/E
- Current Ratio: Definition, Calculation & Financial Health
- Operating Ratio: Definition, Calculation & Importance
- Quick Ratio: Understanding Your Business's Short-Term Liquidity
- Reserve Ratio Explained: Understanding Bank Reserves
- Understanding the Retention Ratio: Reinvesting for Growth
- Sharpe Ratio: Calculate & Interpret Investment Performance
-
 Loan-to-Value (LTV) Ratio: Understanding Risk & Home Equity
The loan-to-value (LTV) ratio is a financial ratio that compares the size of a loan to the value of an asset that is purchased using the proceeds of the loan. The LTV ratio is an important metric that...
-
![Shareholder Equity Ratio: Definition & Calculation | [Your Company Name]](https://www.etffin.com/article/uploadfiles/202110/2021100815180064_S.png) Shareholder Equity Ratio: Definition & Calculation | [Your Company Name]
Shareholder Equity Ratio: Definition & Calculation | [Your Company Name]The shareholder equity ratio is a ratio that shows the amount of a company’s assets that have been financed using the owner’s equity instead of debt. It shows the portion of shareholders&r...