Fast Stochastic Indicator: Definition, Calculation & Trading Strategies
The fast stochastic indicator (%K) is a momentum technical indicator that aims to measure the trend in prices and identify trend reversals. The indicator was developed by securities trader and technical analyst George Lane.
The indicator is driven by two parameters: the lookback period and the smoothing parameter. The lookback period is the period over which the oscillator is calculated. The smoothing parameter is the number of periods over which the moving averageMoving AverageA moving average is a technical indicator that market analysts and investors may use to determine the direction of a trend. It sums up the data points of the oscillator is calculated. It is called an oscillator because the value of the indicator oscillates between 0 and 100. It can be computed as follows:
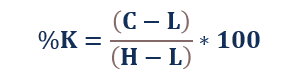
Where:
- C = Current Price
- L = Period Low
- H = Period High
- %K = The fast oscillator computed using the above formula
The lookback period is usually 5 days or 14 days, but it can be any number between 5 days and 21 days. The indicator is not effective over longer periods because, over longer periods, stock prices tend to assume an upward trend.
There is also a second quantity computed known as %D, which is the 3-day SMA of the %K. It is a smoothed version of the %K. It is computed because %K is a volatile indicator and can lead to spurious signals. A smoothed version (%D) moves much slower than the %K; hence the signals generated indicate a stronger trend.
Interpretation
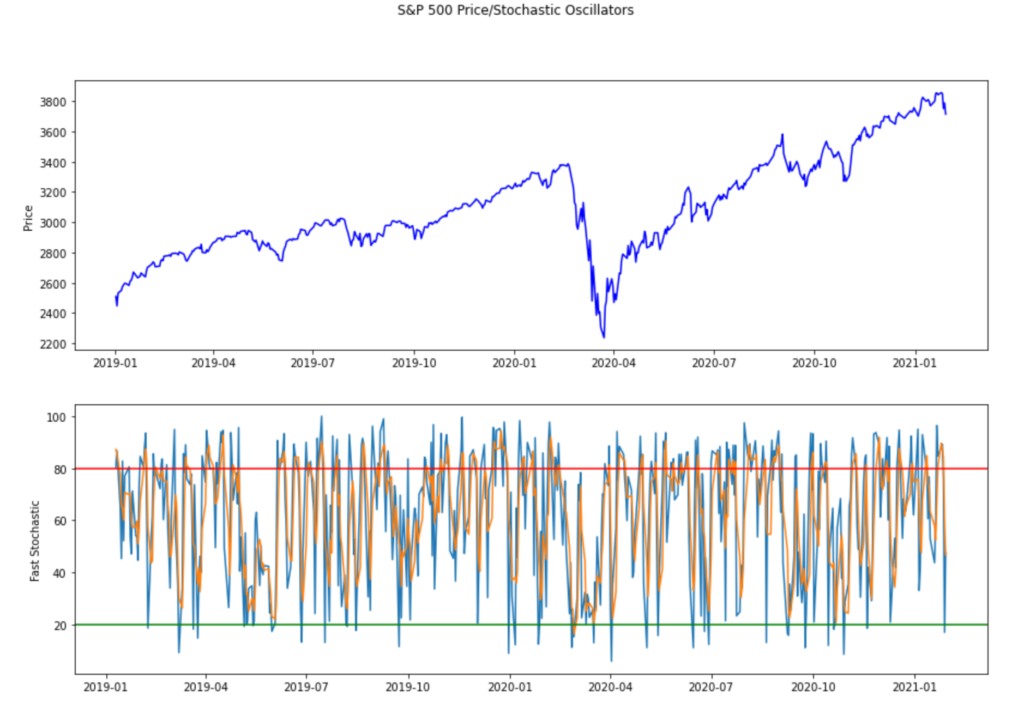
The fast stochastic oscillator (%K) is a momentum indicatorMomentum IndicatorsMomentum indicators are tools utilized by traders to get a better understanding of the speed or rate at which the price of a security changes. Momentum, and it is used to identify the strength of trends in price movements. It can be used to generate overbought and oversold signals. Typically, a stock is considered overbought if the %K is above 80 and oversold if %K is below 20. Other widely used levels are 75 and 25, respectively.
The above levels may be used as buy (%K below 20) or sell (%K above 80) to create a simple mechanical trading strategy. In practice, the thresholds are used in combination with other indicators and serve as warning signals.
George Lane’s Strategy
George Lane, the indicator’s creator, suggests the following strategy. Treat the overbought and oversold thresholds as preconditions. Once the indicators hit such levels, the trader must look for a divergence. A divergence is when the price moves in a different direction from the indicator. There are two types of divergences, bull divergence and bear divergence.
1. Bull Divergence
The bull divergence is used to identify buy signals. When the stochastic oscillator falls below 20, the trader should look for two further conditions. First, the trader should check if the %K has fallen below %D, then see if there is a divergence in the movement of %K and the stock price.
If the stock price has fallen further, but the %K rises, then it is a reversal in the trend. According to the stochastic oscillator analysis, it is a buy signal, and the trader should place a buy order. The stock is sold when the oscillator crosses 80, and a sell signal is generated.
2. Bear Divergence
The bear divergence is used to identify sell signals. When the stochastic indicator rises above 80, it is the precondition to search for the bear divergence. A bear divergence occurs when the %K is above %D.
Further, the stock price makes a high while the oscillator (%K) falls. It indicates a weakness in the uptrend and that the price may begin to fall. According to stochastic oscillator analysis, it is a sell signal, and the trader should place a sell order. The stock is repurchased when the next buy signal is generated.
The above system can also be used for a long-short framework, where, instead of just selling the stock, the trader can actively short the stock when a sell signal is generated by the indicator. It is a riskier strategy but can be used as a trend-following strategy for hedging tail risk.
Excel Tutorial
The slow stochastic indicator can be easily computed using MS Excel. The following is a short tutorial on how to calculate the indicator.
Step 1: Collect the daily closing prices of the index or the stock to study.
Step 2: Calculate the Fast Stochastic Oscillator over the desired lookback period (5-21 days). Use the MIN() and MAX() functions to calculate the low price (L) and high price (H), respectively. Compute the Fast %K using the above formula. (See below)
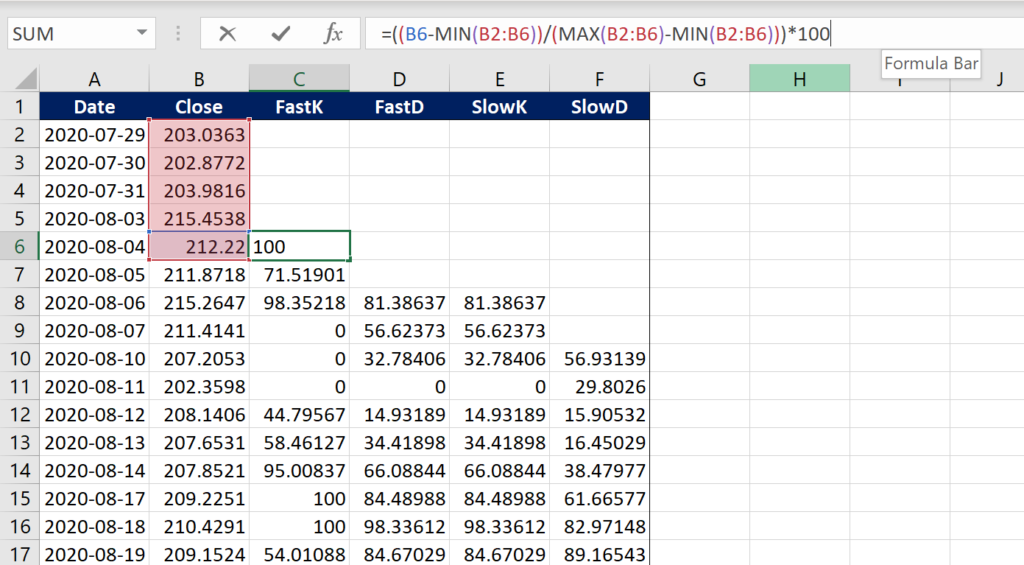
Step 3: Compute the 3-day simple moving average of the Fast Stochastic Oscillator (Fast %K) to get the %D (equivalent to the Slow %K).
Trading Strategy
A simple trading strategy using the fast stochastic indicator can be executed as follows:
The stochastic indicator generates buy and sell signals. The signals can be used to create a dedicated long or short strategy, as well as a long-short strategy. In our strategy, the buy signal is generated when the %K falls below 20, and a sell signal is triggered when the %K rises above 80.
The strategy is a long-short strategy. When the buy signal is triggered, the strategy is long the S&P 500 IndexS&P 500 IndexThe Standard and Poor’s 500 Index, abbreviated as S&P 500 index, is an index comprising the stocks of 500 publicly traded companies in the with a 100% weight. On the other hand, when a sell signal is generated, the strategy is short the S&P 500 Index with a negative 50% weight.
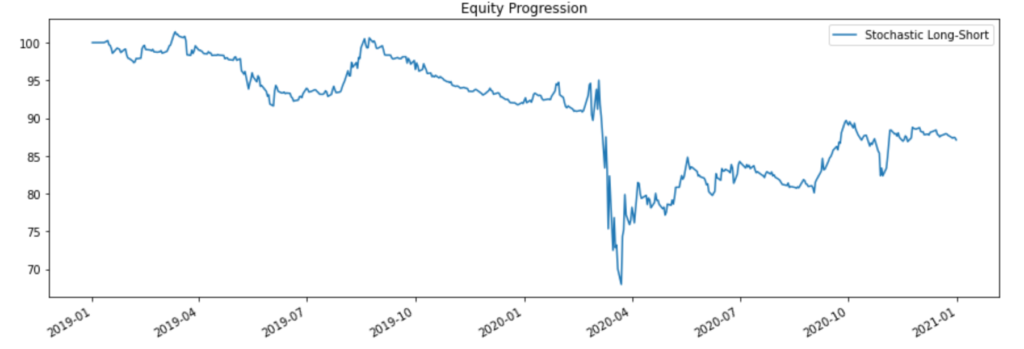
The result of following the above strategy is summarized below:
The total return for the strategy over the backtest period is -15%, compared to a simple buy and hold for the S&P 500 Index over the same period, which would’ve returned close to 50%. It is an unprofitable strategy in the long run, but the chart reveals something interesting. The short portion of the strategy is effective at making money during a drawdown. It is further supported by the fact the indicator generates more sell signals than by signals. (See Figure 4 below).
Fast vs. Slow Indicator
The fast stochastic indicator is much more volatile than the slow indicator. It generates many more buy and sell signals than the slow indicator. If followed naively, the choppiness of the fast indicator can lead to increased transaction costsTransaction CostsTransaction costs are costs incurred that don’t accrue to any participant of the transaction. They are sunk costs resulting from economic trade in a market. In economics, the theory of transaction costs is based on the assumption that people are influenced by competitive self-interest. due to the many trading signals. The signals generated may not be as strong, and there might be losses due to an incorrect decision.
The fast indicator is also more prone to being stuck at the extremes of 0 and 100 for longer periods of time than the slow indicator. Hence, the slow stochastic indicator was developed to overcome the high volatility of the fast indicator.
Additional Resources
To keep learning and advance your career, the following resources will be helpful:
- Advanced Technical AnalysisAdvanced Technical AnalysisAdvanced technical analysis usually involves using either multiple technical indicators or a rather sophisticated (i.e., complex) indicator. "Sophisticated"
- Momentum InvestingMomentum InvestingMomentum investing is an investment strategy aimed at purchasing securities that have been showing an upward price trend or short-selling securities that
- Technical IndicatorTechnical IndicatorA technical indicator is a mathematical pattern derived from historical data used by technical traders or investors to predict future price
- VolatilityVolatilityVolatility is a measure of the rate of fluctuations in the price of a security over time. It indicates the level of risk associated with the price changes of a security. Investors and traders calculate the volatility of a security to assess past variations in the prices
-
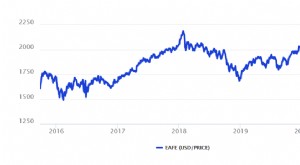
EAFE Index: Understanding Developed Market Performance
The EAFE Index (Europe, Australasia, and the Far East) was created to measure the performance of the stock markets in developed markets – excluding the U.S. and Canada. The indicator is maintain
-

Understanding the Healthcare Sector: Key Overview & Importance
The healthcare sector is one of 11 S&P sectors or GICS (Global Industry Classification Standard) used by the financial community. It is consistently in the top three most weighted sectors of the S
invest
- Dow 30 Explained: Understanding the Dow Jones Industrial Average
- Fractal Indicator: Identify Trend Reversals in Trading
- Harvard MBA Indicator: A Guide to Investment Opportunities
- Understanding the -DI: A Guide to Negative Directional Indicators
- On-Balance Volume (OBV): Understanding Trading Momentum
- Qstick Indicator: Definition, Calculation & Trading Strategies
- Slow Stochastic Indicator: Definition, Calculation & Interpretation
- Stochastic Oscillator: Understanding Momentum & Trading Signals
- Vortex Indicator (VI): A Comprehensive Guide for Trend Analysis
-
 Understanding the Dot-Com Bubble: Causes, Impact & Lessons Learned
The dotcom bubble is a stock market bubble that was caused by speculation in dotcom or internet-based businesses from 1995 to 2000. The companies were largely those with a “.com” domain on...
-
 Understanding the Dow Divisor: How It Impacts the DJIA
The Dow divisor, in simple terms, is a number used to help calculate the Dow Jones Industrial Average (DJIA)Dow Jones Industrial Average (DJIA)The Dow Jones Industrial Average (DJIA), also referred to...