Harvard MBA Indicator: A Guide to Investment Opportunities
The Harvard MBA indicator is designed to help individuals evaluate investment market opportunities based on how many Harvard MBA students are working in what are deemed “market-sensitive fields.”

The Harvard MBA indicator is a long-term, contrarian indicator. It provides a calculation of the total number of students graduating from Harvard Business School with an MBA that is entering into working in certain business sectors. The positions include:
- Investment Banking
- Private EquityWhy Private EquityWhy Private Equity is a common private equity interview question you’ll encounter if you’re going through the interview process at a PE firm
- Securities Sales and Trading
- Venture Capital
- Leveraged Buyouts (LBOs)Leveraged Buyout (LBO)A leveraged buyout (LBO) is a transaction where a business is acquired using debt as the main source of consideration.
When the Harvard MBA indicator reveals that at least 30% of all Harvard business graduates enter the market-sensitive fields mentioned above, a general stock market sell signal is indicated. For example, assume that there’s a flood of Harvard MBAs into the investment banking field. In that case, according to the indicator, the stock market as a whole is in danger of turning bearish.
However, when the percentages of Harvard graduates pursuing such careers fall below 10%, the indicator instead generates a signal that indicates good prospects for a rising stock market.
Summary
- The Harvard MBA indicator is a long-term, contrarian indicator that calculates how many Harvard Business School graduates are pursuing market-sensitive fields related to finance and trading.
- If 30% or more of Harvard MBA students are heading into sensitive market positions, the indicator suggests that it is a good time to sell stocks. Conversely, if 10% or less are heading into such positions, the indicator provides an overall buy signal for stocks.
- The Harvard MBA indicator is esoteric and considered somewhat antiquated; it is typically only used in conjunction with other technical indicators.
History of the Harvard MBA Indicator and How it Functions
In shorthand, the Harvard MBA Indicator is sometimes referred to more simply as the HBS (Harvard Business School) Indicator. The HBS indicator is somewhat esoteric, meaning it’s not really intended to be used by a broad audience but by more specialized traders who understand its significance. Additionally, even traders who use it rarely use it as a sole trading indicator. However, they instead combine it with other indicators used to track the finance and trading industries, such as profit margin and debt-to-equity ratioDebt to Equity RatioThe Debt to Equity Ratio is a leverage ratio that calculates the value of total debt and financial liabilities against the total shareholder’s equity..
When the Harvard MBA indicator is referred to as long-term and contrarian, the indicator is designed to provide long-term investment signals based on the extent to which Harvard MBA students are attracted to certain positions on Wall Street.
The contrarian piece comes in because the indicator follows an older adage: “The more attracted students are to various positions on Wall Street, the more overbought Wall Street becomes.” It is an indicator that the stock market is saturated and most likely nearing a breaking point. In other words, “when everyone wants in, it’s time to get out.”
The Harvard MBA indicator was launched and operated by a Harvard business school alumnus Roy Soifer, a student who graduated in 1965. The most prominent examples of the indicator functioning with promise came in 1987 and 2000. In both instances, stocks were at high levels, and Wall Street was overloaded with Harvard MBAs. In both cases, the indicator supplied sell signals, indicating stocks were reaching critical levels and were about to tank. In both instances, the indicator was eventually proven correct by a substantial bear market that followed.
Notes About the Harvard MBA Indicator’s Performance
By 2008, the Harvard MBA indicator wasn’t being used as prevalently by market tradersSix Essential Skills of Master TradersJust about anyone can become a trader, but to be one of the master traders takes more than investment capital and a three-piece suit. Keep in mind: there is a sea of individuals looking to join the ranks of master traders and bring home the kind of money that goes with that title.. However, history shows us that the indicator provided more than enough evidence that the market was saturated around that time frame and that some form of a bubble was about to burst. At about the time of the housing market crash in the United States, the indicator reached its record high of 41%.
On the opposite end of the spectrum, the record low for the indicator was in 1937. Only about 1% of Harvard MBA students were heading into sensitive market positions, thus indicating it was a great time to start buying stocks.
Soifer, himself, widely stated that the Harvard MBA indicator produces substantially more sell signals than it provides buy signals. The last noteworthy time that the indicator produced a 10% long-term buy signal was in 1982. It proved, however, a sage worthy indicator of the massive bull market in stocks that followed.
Learn More
CFI is the official provider of the global Capital Markets & Securities Analyst (CMSA)®Program Page - CMSAEnroll in CFI's CMSA® program and become a certified Capital Markets &Securities Analyst. Advance your career with our certification programs and courses. certification program, designed to help anyone become a world-class financial analyst. The following CFI resources will be helpful in furthering your financial education and advancing your career:
- Bullish and BearishBullish and BearishProfessionals in corporate finance regularly refer to markets as being bullish and bearish based on positive or negative price movements. A bear market is typically considered to exist when there has been a price decline of 20% or more from the peak, and a bull market is considered to be a 20% recovery from a market bottom.
- ContrarianContrarianA contrarian is an individual who acts in opposition to the majority. In terms of investing, a contrarian investor is someone who trades against prevailing market sentiments. When the market buys, they sell, and vice-versa.
- Market IndicatorMarket IndicatorA market indicator is a quantitative tool that is used by traders to interpret financial data in order to forecast stock market movements.
- Master of Business Administration(MBA)Master of Business Administration (MBA)An MBA, also known as a Master of Business Administration, is a post-secondary degree that provides in-depth knowledge and training from the perspective of
-
Understanding Implied Rates: A Comprehensive Guide
The implied rate is an interest rate that expresses the difference between the forward/future rate and the spot rate. It serves as a useful tool for comparing returns across different assets and can b
-
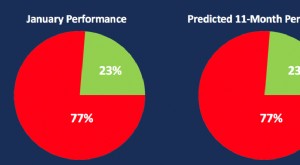
January Barometer: Predicting Market Performance - Explained
The January Barometer is the idea that the investment performance of the S&P 500S&P 500 IndexThe Standard and Poor’s 500 Index, abbreviated as S&P 500 index, is an index comprising t
invest
- Dow 30 Explained: Understanding the Dow Jones Industrial Average
- Fast Stochastic Indicator: Definition, Calculation & Trading Strategies
- Fractal Indicator: Identify Trend Reversals in Trading
- Understanding the -DI: A Guide to Negative Directional Indicators
- On-Balance Volume (OBV): Understanding Trading Momentum
- Qstick Indicator: Definition, Calculation & Trading Strategies
- Rule of 72: Calculate Investment Doubling Time | [Your Brand Name]
- Slow Stochastic Indicator: Definition, Calculation & Interpretation
- Vortex Indicator (VI): A Comprehensive Guide for Trend Analysis
-
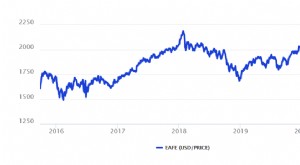 EAFE Index: Understanding Developed Market Performance
The EAFE Index (Europe, Australasia, and the Far East) was created to measure the performance of the stock markets in developed markets – excluding the U.S. and Canada. The indicator is maintain...
-
 Understanding the Healthcare Sector: Key Overview & Importance
The healthcare sector is one of 11 S&P sectors or GICS (Global Industry Classification Standard) used by the financial community. It is consistently in the top three most weighted sectors of the S...