Trading Channels: Understanding Uptrends & Downtrends
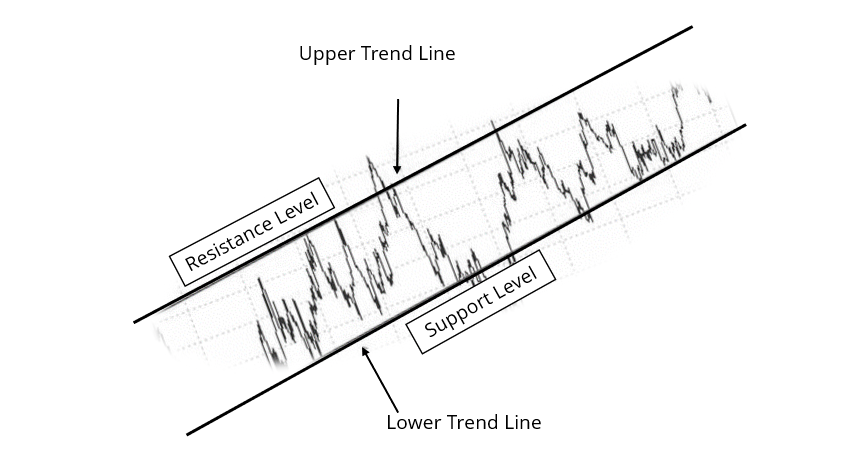
A trading channel is a chart pattern highlighted by two parallel lines bordering resistance and support within which a security trades during a period. Within a valid uptrend trading channel, an opportunity to buy into the uptrend is indicated by subsequent bounces up off the support level at the point where the price touches the support level at least twice.
The same is true for a downtrend trading channel where subsequent price movement shifts from the resistance level to the point where the price touches the resistance level at least twice to allow traders to sell.
Summary
- A trading channel is drawn using parallel lines that follow the price floor (support) and price ceiling (resistance).
- With a trading channel, smart traders sell stocks at the upper resistance line, hold stocks within the parallel trend lines, and buy stocks at the lower support lines.
- Technical analysts rely on trading channels for information to guide both long-term analysis and trading decisions.
Understanding Trading Channels
Trading channels come in handy as they highlight support and resistance linesResistance LineA Resistance Line, sometimes also known as a Speed Line, helps identify stock trends and levels of support and resistance. Resistance lines are technical indication tools used by equity analysts and investors to determine the price trend of a specific stock. graphically. Technical traders often use trading channels to assess whether to purchase or sell their positions. Traders also use the channels to evaluate existing market volatility.
The upper resistance level in an uptrend trading channel marks the opportunity to sell stocks, while the downward support lines suggest an opportunity to buy securities. Using trading channels, technical analysts can track different patterns within a channel to identify short-term price movements and draw insights for long-term analysis and trading strategies.
A trading channel is identified using parallel trend lines and plotted on a security price series chart. Theoretically, traders believe that market prices will stay within a trading channel. They plan to buy at higher highs and sell at lower lows within the established trading channel. Although range trading is generally good for investors, a channel breakout occurs when a bigger opportunity presents itself.
Types of Trading Channels
1. Trend channel
In trend channels, the price series of a security shows the defined trend lines that slope at the support and resistance lines. Trend channels are not appealing to long-term traders since their entries represent clear counter-trend trades that cannot flow through reversals.
The activities of the trend channels depend on the trend cycle of securities. The trend cycles typically extend across exhaustion gaps, runaway gaps, and breakout gaps. Essentially, trend channels, when plotted on a graph, can either be ascending, flat, or descending.
2. Flat channel
The flat type of trend channel is formed when the slope of trendlines is zero. They are usually represented as a sideway market price movement without a downward or upward trend.
3. Ascending channel
The ascending type of trend channel is formed by two sloping parallel lines with a positive gradient at the support and resistance levels. The ascending channel exhibits a bullish trendBullish and BearishProfessionals in corporate finance regularly refer to markets as being bullish and bearish based on positive or negative price movements. A bear market is typically considered to exist when there has been a price decline of 20% or more from the peak, and a bull market is considered to be a 20% recovery from a market bottom. when graphed on a price series chart.
4. Descending channel
The characteristics of a descending channel are two negative sloping trend lines at the point of support or resistance lines. As such, the trading channel exhibits a bearish trend.
5. Envelope channel
Envelope trading channels take longer-term price movements into consideration, making them useful to traders looking to extend their stay on the market. Trendlines used to draw envelope channels are statistically determined. Some of the most commonly used envelope channels are the Donchian Channel and Bollinger Bands.
6. Donchian Channel
The trendlines in Donchian channelsDonchian ChannelsDonchian Channels are a channel-based technical analysis trading strategy used as an indicator for trading in financial markets. are derived from high and low prices. At the same time, the high over a predetermined period (n) is used in drawing the resistance trendline.
On the other hand, the support line is derived from the security’s low over a predetermined period. Creating Donchian channels requires the use of various periods in which resistance and trendlines are referred after 21 days.
Indicators of a Trading Channel
In channel trading, when a stock’s price meets a resistance level, a trader will sell a long position, or alternatively, open a short position. The theoretical explanation behind the strategy is that a stock’s price will retrace back into the channel when it reaches the resistance level, and vice-versa when meeting a support level.
The trading strategy is followed only if the price does not break through above resistance or below support levels. If the price violates the conditions, it instead suggests a momentum trend or a breakout pattern is occurring.
Thus, the trading channel strategy is based on the notion that a stock’s price is expected to trade within a range. Due diligence is needed when using trend channels, given the possibility of breakouts occuring. Trend patterns are not always predictable in financial markets, making it difficult to always make maximum profits using this trading strategy.
Additional Resources
CFI is the official provider of the Capital Markets & Securities Analyst (CMSA)®Program Page - CMSAEnroll in CFI's CMSA® program and become a certified Capital Markets &Securities Analyst. Advance your career with our certification programs and courses. certification program, designed to transform anyone into a world-class financial analyst.
In order to help you become a world-class financial analyst and advance your career to your fullest potential, these additional resources will be very helpful:
- Bollinger BandsBollinger Bands®"Bollinger Bands" are a technical analysis tool developed by John Bollinger in the 1980s for trading stocks. The bands comprise a volatility indicator that measures the relative high or low of a security's price in relation to previous trades.
- Long and Short PositionsLong and Short PositionsIn investing, long and short positions represent directional bets by investors that a security will either go up (when long) or down (when short). In the trading of assets, an investor can take two types of positions: long and short. An investor can either buy an asset (going long), or sell it (going short).
- Technical AnalystTechnical AnalystA technical analyst is a professional with skills and relevant knowledge to explore the financial market and derive relevant temporal
- VolatilityVolatilityVolatility is a measure of the rate of fluctuations in the price of a security over time. It indicates the level of risk associated with the price changes of a security. Investors and traders calculate the volatility of a security to assess past variations in the prices
-

Circuit Breakers: Understanding Trading Halts & Market Stability
A circuit breaker is a regulatory instrument that halts the trading of a securityStockWhat is a stock? An individual who owns stock in a company is called a shareholder and is eligible to claim part o
-

Understanding Commodities: A Beginner's Guide to Investing
Commodities are another class of assets just like stocks and bondsBondsBonds are fixed-income securities that are issued by corporations and governments to raise capital. The bond issuer borrows capit
invest
- CFD Trading Explained: A Comprehensive Guide for Investors
- Day Trading Explained: Strategies, Risks & How It Works
- Understanding Horizontal Channels in Trading: A Comprehensive Guide
- Proprietary Trading: A Comprehensive Guide for Investors
- Quantitative Trading: A Deep Dive into Models & Analysis
- Spread Trading: A Comprehensive Guide to Relative Value Trading
- Trading Authorization: Empowering Your Broker & Account Security
- Trading Plan: A Comprehensive Guide to Successful Trading
- Understanding Trading Sessions: Hours & Global Markets
-
 Understanding Ascending Channels: A Technical Analysis Guide
An ascending channel occurs when visually analyzing an overall uptrend in the asset price of a stockStockWhat is a stock? An individual who owns stock in a company is called a shareholder and is eligi...
-
 Basis Trading: Definition, Strategy & How It Works
Basis trading is a financial arbitrage trading strategy that involves the trading of a financial instrument, such as a financial derivative or a commodityCommoditiesCommodities are another class of as...