Roy's Safety-First Criterion: A Comprehensive Guide
Roy’s safety-first criterion is a risk managementRisk ManagementRisk management encompasses the identification, analysis, and response to risk factors that form part of the life of a business. It is usually done with technique used by investors to compare and choose a portfolio based on the criterion that the probability of a portfolio’s return dropping below a threshold level return is reduced.
In Roy’s safety-first criterion, the optimal portfolio is one that minimizes the probability of the portfolio’s return falling below a threshold return level. The portfolio with the highest Roy’s safety-first criterion has the lowest probability of a portfolio generating a return lower than the threshold level return.
Summary:
- Roy’s safety-first criterion is used by investors to choose a portfolio based on the criterion that the probability of the portfolio’s return dropping below a threshold level is reduced.
- The value given by Roy’s safety-first criterion indicates the number of standard deviations below the mean.
- The formula for Roy’s safety-first criterion is [E(RP) – RL] / σp
Formula for Roy’s Safety-first Criterion

Where:
- E(Rp) is the expected portfolio return;
- RL is the threshold level return (the minimum acceptable return); and
- σp is the standard deviation, or risk, of the portfolio.
Note that the formula for Roy’s safety-first criterion assumes that portfolio returns are normally distributed.
Visual Representation of Roy’s Safety-first Criterion
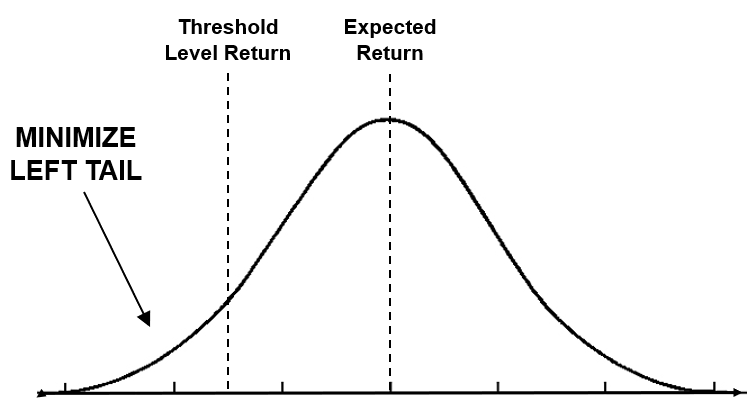
Where:
- Expected Return is E(Rp); and
- Threshold Level Return is RL.
The goal of Roy’s safety-first criterion is to minimize the left tail. The area to the left of the threshold level return is the probability of the portfolio generating a return less than the threshold.
The value given by Roy’s safety-first criterion indicates the number of standard deviations below the mean. For example, a value of 1 indicates one standard deviationStandard DeviationFrom a statistics standpoint, the standard deviation of a data set is a measure of the magnitude of deviations between values of the observations contained below the mean. Therefore, the higher the criterion value, the smaller the left tail and the lower the probability of the portfolio generating a return less than the threshold.
Shortfall Risk and Roy’s Safety-first Criterion
Shortfall risk and Roy’s safety-first criterion goes hand-in-hand. Shortfall risk is the probability of generating a return lower than the threshold level return. In other words, shortfall risk is the area to the left of the threshold level return on a normal distribution graph. It is important to note that:
The higher the safety-first criterion, the lower the shortfall risk.
The lower the safety-first criterion, the higher the shortfall risk.
The shortfall risk can be calculated through a z-table for negative values. Below, we will do a comprehensive example.
For example, consider a portfolio with an expected return of 5%, a standard deviation of 10%, and a threshold return level of 0%. What are the Roy’s safety-first criterion and shortfall risk assuming that the portfolio is normally distributed?
The Roy’s safety-first criterion is calculated as (5% – 0%) / 10% = 0.5.
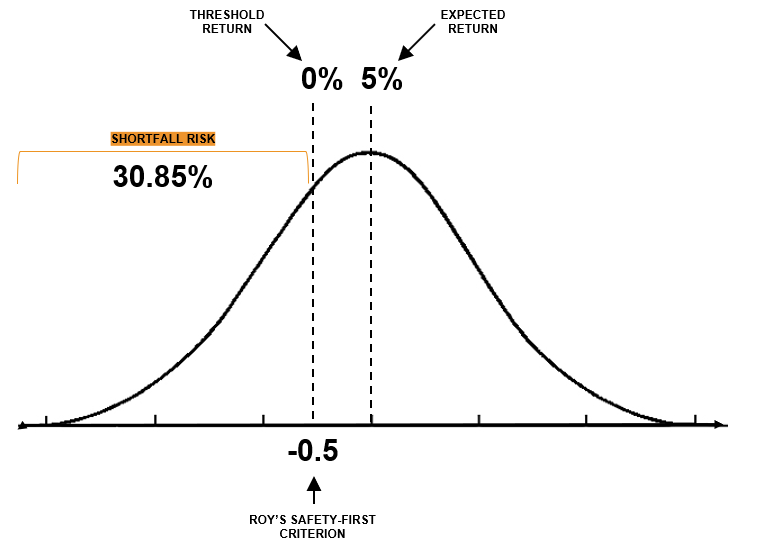
Illustrated above, the expected return is 5%, the threshold return is 0%, and Roy’s safety-first criterion yields 0.5, which is 0.5 standard deviations below the expected return. Shortfall risk is the area under the curve starting from the left of the threshold return. Using a z-table for negative values, -0.5 corresponds to a z-score of 0.3085 or 30.85%.
Example of Roy’s Safety-first Criterion
Consider three portfolios with the return and risk profiles provided below. Assume that the investor wants to minimize the probability of the portfolio returning less than 0%. In other words, the investor’s minimum acceptable return is 0%. Based on Roy’s safety-first criterion, which portfolio should the investor invest in?
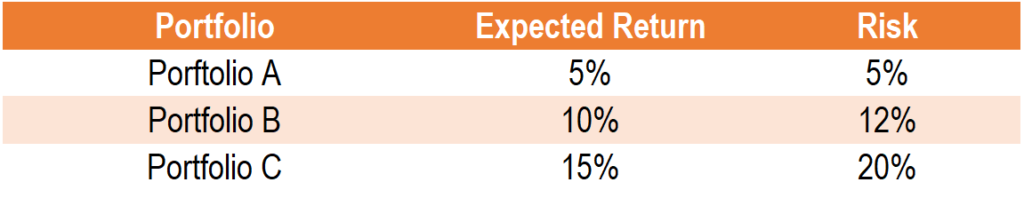
The Roy’s safety-first criterion for Portfolio A is calculated as (5% – 0%) / 5% = 1.
The Roy’s safety-first criterion for Portfolio B is calculated as (10% – 0%) / 12% = 0.83.
The Roy’s safety-first criterion for Portfolio C is calculated as (15% – 0%) / 20% = 0.75.
Based on Roy’s safety-first criterion, the ratio with the largest safety-first criterion has the lowest probability of getting a return less than 0%. In our example, it would be Portfolio A.
Related Readings
CFI is the official provider of the Financial Modeling and Valuation Analyst (FMVA)™Become a Certified Financial Modeling & Valuation Analyst (FMVA)®CFI's Financial Modeling and Valuation Analyst (FMVA)® certification will help you gain the confidence you need in your finance career. Enroll today! certification program, designed to transform anyone into a world-class financial analyst.
To keep learning and developing your knowledge of financial analysis, we highly recommend the additional resources below:
- Basis RiskBasis RiskBasis risk is the risk that the futures price might not move in normal, steady correlation with the price of the underlying asset, so as to negate the effectiveness of a hedging strategy in minimizing a trader's exposure to potential loss. Basis risk is accepted in an attempt to hedge away price risk.
- Investing: A Beginner’s GuideInvesting: A Beginner's GuideCFI's Investing for Beginners guide will teach you the basics of investing and how to get started. Learn about different strategies and techniques for trading
- Rate of ReturnRate of ReturnThe Rate of Return (ROR) is the gain or loss of an investment over a period of time copmared to the initial cost of the investment expressed as a percentage. This guide teaches the most common formulas
- Total Probability RuleTotal Probability RuleThe Total Probability Rule (also known as the law of total probability) is a fundamental rule in statistics relating to conditional and marginal
-

Understanding Excess Returns (Alpha): A Comprehensive Guide
The term “excess returns” is used to denote how a fund has performed compared to a benchmark. Excess return, which is also known as alpha, can provide an indication of whether a respective
-

Mean-Variance Analysis: A Guide for Investors
Mean-Variance Analysis is a technique that investors use to make decisions about financial instruments to invest in, based on the amount of risk that they are willing to accept (risk tolerance). Ideal
invest
- Understanding Alpha: A Guide to Investment Performance
- Cash-on-Cash Return: Definition, Calculation & Importance
- Understanding Rate of Return: A Comprehensive Guide
- Return on Ad Spend (ROAS): Definition & Importance for eCommerce
- Understanding Abnormal Returns: A Guide to Investment Performance
- Understanding Absolute Return: A Comprehensive Guide
- Understanding Average Return: A Simple Guide
- Understanding Expected Return: A Comprehensive Guide
- Understanding NAV Return: A Key Performance Indicator
-
 Understanding Portfolio Active Return: Definition & Calculation
Active return refers to the gains or losses from a portfolio that are directly related to the decisions made by the portfolio manager. The active return can be positive or negative, depending on wheth...
-
 Understanding Rate of Return (ROR): Calculation & Applications
Rate of return (ROR) is the net gain or loss on an investment over a period of time. It has a lot of variations and applications. Besides investments, rate of return can apply to corporate profits, th...