Trading Curb: Understanding Temporary Market Halts
A trading curb is a temporary trading halt imposed in an effort to reduce market volatility and massive panic sell-offs. It is also called a circuit breakerCircuit BreakerA circuit breaker is a regulatory instrument that halts the trading of a security or an index for a certain period. Circuit breakers are triggered when a security experiences a large percentage swing in either direction or a market index experiences a catastrophic decline. and is instituted to reduce market volatility and information asymmetry by giving traders enough time to respond with full information. Amid extreme market swings, a trading curb is imposed as a market intervention during a normal trading process in the hope of stabilizing prices and restoring the market to normalcy.
Summary
- A trading curb is a measure used to temporarily halt trade to stabilize the stock market in the face of large price movements to reduce excess market volatility.
- A trading curb is instituted to curb the potential negative impacts of intraday trading turmoil on market stability.
- There are three levels on the U.S stock exchanges that would induce trading curbs: Level 1 break, Level 2 break, and Level 3 break.
Early History of Trading Curbs
A trading curb is a regulatory requirement to shut the market down under Rule 80B of the Securities and Exchange Commission (SEC). It is aimed at reducing market volatility by imposing a temporary halt on trading on a specific security.
The first trading curb was implemented in the U.S. following the Black Monday of 1987, when the stock market, alongside associated futures and options markets, crashed. It was a market-wide circuit breaker advocated by the Brady Commission after the S&P 500 stock market dropped by approximately 20% and was subsequently implemented in 1988.
The trading curb initiated in 1987 assumed that program trading was the reason behind the crash exacerbated by the difficulty in gathering information in a rapidly changing and chaotic environment. The 2010 Flash Crash2010 Flash CrashThe 2010 Flash Crash is the market crash that occurred on May 6, 2010. During the 2010 crash, leading US stock indices, including the Dow marked the subsequent amendment of the rule in response to the market turbulence.
Activation of Trading Curbs
The activation of a trading curb attempts to prevent excessive intraday price fluctuation by allowing the market to catch its breath during an unusually turbulent day. Temporary trading halts give traders more time to gather and evaluate more information to make rational decisions and synchronize trading better when the curbs are lifted.
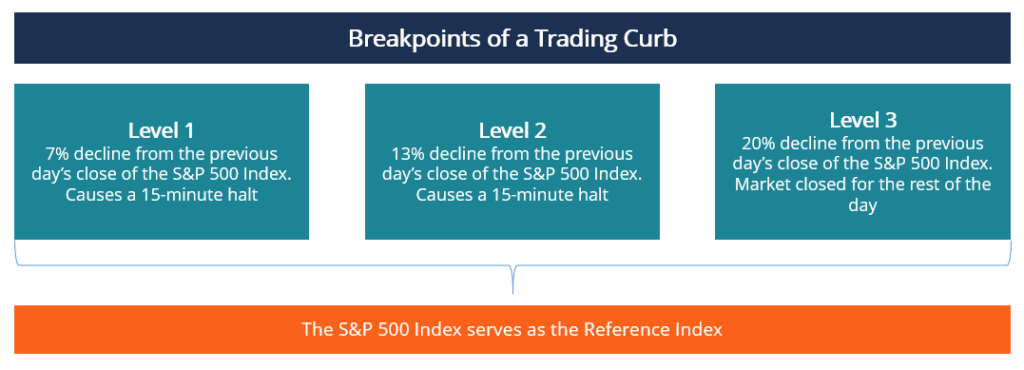
On U.S. exchanges, a trading curb applies to all equities, optionsOptions: Calls and PutsAn option is a derivative contract that gives the holder the right, but not the obligation, to buy or sell an asset by a certain date at a specified price., and futures and is applied in accordance with the breakpoints. Breakpoints are calculated daily, with the S&P 500 Index serving as the reference index.
Typically, there are three breaking points that would cause trading to be suspended, namely Level 1, Level 2, and Level 3. The breaking points are outlined below:
- Level 1: Lower circuit level is triggered if the previous day’s S&P 500 Index closed with a decline of 7%. If a stock market crash is determined to be Level 1, trading is halted for 15 minutes, but the halt will not be imposed if the 7% decline occurs within 35 minutes of market close.
- Level 2: Level 2 circuit is initiated if the previous day’s S&P 500 Index closed with a 13% decline in which the market is disrupted for 15 minutes. However, no trading is halted if the decline occurs within 35 minutes of closing trade.
- Level 3: The upper circuit is imposed if the previous day’s S&P 500 Index closed with a 20% drop in which the market is shut down for the remainder of the day.
According to the current SEC rules, a security that is a member of either of QQ ETF, S&P 500 IndexS&P 500 IndexThe Standard and Poor’s 500 Index, abbreviated as S&P 500 index, is an index comprising the stocks of 500 publicly traded companies in the, or Russell 1000 Index attracts a trading halt if its value changes by 10% within five minutes.
Alternatively, a trading halt can be triggered if a security whose market price is equal to or greater than $1 per share experiences a 30% value change. A security whose price is less than $1 per share can also trigger a trading halt if its value changes by 50% within a five-minute time frame.
Classification of Trading Curbs
There are three types of circuit breakers, with each circuit breaker addressing different design capability situations, as explained below:
1. Order-imbalance circuit breakers
The order-imbalance circuit breakers are instituted on individual stocks at the request of a specialist. The specialist orders trade to be suspended on an individual stock in the face of an order imbalance. The temporary halt allows the specialist to gather enough information and establish a market-clearing price.
2. Volume-induced circuit breakers
The level of trading volume determines the cost-effectiveness of order processing. Breakeven costs are usually not met at low trading levels. Revenues generated from trading must be used to cover the fixed costs of operations, as recognized in the determination of trading exchange hours.
Scheduled closings are based on the idea that additions of operation costs will not be compensated adequately. Daily closes can be construed as the initiation of a trading curb.
3. Price-limit circuit breakers
Historically, the objective of circuit breakers policies is to keep volatility in check. Price limits in futures markets restrict trading within the upper and lower horizontal linesHorizontal LineA horizontal line is a line drawn touching the support or resistance level on a price chart in technical analysis. of the previous day’s closing. However, in the recent past, stock index contracts’ price limits have been set at market-closing rules to control price swings in futures contracts and cash markets.
The rule is evident when short trades are not offered on up-limit days, and the same is true for long trades on down-limit days. In the past, the rules on future exchanges incorporated the price limits into trading rules in response to threatened regulations. Such patterns suggest that without regulatory interventions, the price-induced trading curbs would not exist.
Learn More
CFI offers the Capital Markets & Securities Analyst (CMSA)®Program Page - CMSAEnroll in CFI's CMSA® program and become a certified Capital Markets &Securities Analyst. Advance your career with our certification programs and courses. certification program for those looking to take their careers to the next level. To keep learning and developing your knowledge base, please explore the additional relevant resources below:
- Asymmetric InformationAsymmetric InformationAsymmetric information is, just as the term suggests, unequal, disproportionate, or lopsided information. It is typically used in reference to some type of business deal or financial arrangement where one party possesses more, or more detailed, information than the other.
- Black MondayBlack Monday"Black Monday" – as it is referenced today – took place on October 19 (a Monday) in 1987. On this day, stock markets around the world crashed, though the
- Securities and Exchange Commission (SEC)Securities and Exchange Commission (SEC)The US Securities and Exchange Commission, or SEC, is an independent agency of the US federal government that is responsible for implementing federal securities laws and proposing securities rules. It is also in charge of maintaining the securities industry and stock and options exchanges
- SelloffSelloffA selloff is the selling of a large volume of securities within a short time, causing a corresponding decline in its price. It occurs when a
-

Understanding Market Sentiment: A Guide for Investors
The term market sentiment, also known as investor sentiment, refers to the general outlook or attitude of investors toward a particular security or the overall financial market. The optimism or pessim
-
![Market Timing: Strategies & How It Works | [Your Company Name]](https://www.etffin.com/article/uploadfiles/202110/2021100815253643_S.jpeg)
Market Timing: Strategies & How It Works | [Your Company Name]
Market timing refers to an investing strategy through which a market participant makes buying or selling decisions by predicting the price movements of a financial asset in the future. Investors follo
invest
- Understanding Auction Markets: How Prices Are Determined
- CFD Trading Explained: A Comprehensive Guide for Investors
- Day Trading Explained: Strategies, Risks & How It Works
- Direct Market Access (DMA): A Comprehensive Guide for Investors
- Doji Candlestick Pattern: Meaning & Trading Signals
- Pairs Trading: A Comprehensive Guide to Profiting in Any Market
- Understanding Trading Below Cash: What It Means & Implications
- Trading Curb: Understanding Temporary Market Halts
- Program Trading: Definition, Strategy & Benefits | [Your Company Name]
-
 Understanding Market Manipulation: Definition, Tactics & SEC Role
Market manipulation refers to artificial inflation or deflation of the price of a security. Also known as price manipulation or stock manipulation, it involves the literal manipulation of a financial ...
-
 Understanding Market Risk: A Comprehensive Guide
The term market risk, also known as systematic risk, refers to the uncertainty associated with any investment decision. Price volatility often arises due to unanticipated fluctuations in factors that ...