Understanding Ascending Channels: A Technical Analysis Guide
An ascending channel occurs when visually analyzing an overall uptrend in the asset price of a stockStockWhat is a stock? An individual who owns stock in a company is called a shareholder and is eligible to claim part of the company’s residual assets and earnings (should the company ever be dissolved). The terms "stock", "shares", and "equity" are used interchangeably., bond, or other such investment. It is a method of technical analysis where the bottom line is described as the trendline “support” and the top line is called the “resistance.”
Resistance occurs at the point in a price where the level of selling is strong enough to prevent the price from rising any further (the ceiling of the ascending channel). Support is the bottom trend line where buying is strong enough to prevent the price from falling any further (the floor). The space between the trendlines is the ascending channel of a price.
It allows the trader to make only high-probability trades by shortingLong and Short PositionsIn investing, long and short positions represent directional bets by investors that a security will either go up (when long) or down (when short). In the trading of assets, an investor can take two types of positions: long and short. An investor can either buy an asset (going long), or sell it (going short). an asset when the price of a security approaches the resistance and going long when the price approaches the support line. The opposite of an ascending channel is the descending channel. It is the same concept but in reverse for a falling asset.
The ascending channel analysis technique is often used in equities, derivatives, or forex tradingForex Trading - How to Trade the Forex MarketForex trading allows users to capitalize on appreciation and depreciation of different currencies. Forex trading involves buying and selling currency pairs based on each currency's relative value to the other currency that makes up the pair..
Spotting the Ascending Channel
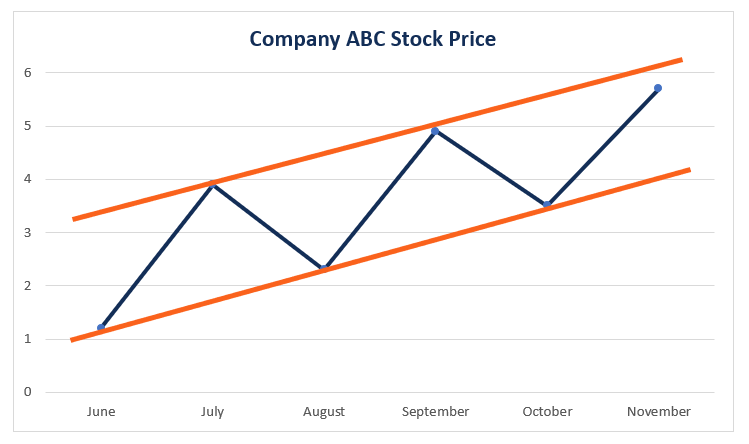
Spotting the ascending channel can sometimes be difficult. Here is a simplified version of the ascending channel depicted as the two solid orange lines that encase Company ABC’s price volatilityVolatilityVolatility is a measure of the rate of fluctuations in the price of a security over time. It indicates the level of risk associated with the price changes of a security. Investors and traders calculate the volatility of a security to assess past variations in the prices:
Creating a Position
After finding the ascending channel and identifying the resistance and support lines, it is time to create a position. Depending on where the price is in the overall trend, the investor can decide if they want to short or go long on an asset, depending on the type of contract they’are looking for.
The investor may also decide to take a wait-and-see approach and stay out of the asset entirely. Timing is a critical component for investors, and knowing the right stock to buy is not as important as knowing when to buy it. The ascending channel can help the investor make that decision.
Technical Analysis Tools
Technical analysis tools like the ascending channel can help you make a more informed decision. However, using it to make decisions exclusively when selecting a stock, bond, or forex trade can lead to a false sense of confidence that can result in making larger and larger trades without first conducting due diligenceDue DiligenceDue diligence is a process of verification, investigation, or audit of a potential deal or investment opportunity to confirm all relevant facts and financial information, and to verify anything else that was brought up during an M&A deal or investment process. Due diligence is completed before a deal closes. and can make you more prone to mistakes. It will invariably leave you and your firm open to more risks.
Understanding that technical tools like the ascending channel as part of a larger macro toolkit is imperative for the savvy investor. No one indicator should be taken out of context, as portfolio analysis and allocation should always be a holistic practice rather than using only one technical indicator.
However, the ascending channel can make for an excellent marker that you are on the right track and should be investigating a potential play on the underlying asset you spot the ascension on.
Price Breakouts
One of the risks an investor will undertake if they become locked into a non-holistic approach and focus only on the ascending channel is that you may experience a price breakout. A price breakout occurs when the stock price “breaks out” of the ascending channel. It will be especially worrisome if you are to short the stock.
Right before a price breakout occurs, the volume of trades on a stock should approach lower levels, in some cases, a historically low level. The ascending channel’s price breakout can end up being an excellent play for the prudent investor. By timing your investment perfectly, one may take advantage of the breakout and make a substantial profit against the move away from the ascending channel.
More Resources
CFI is the official provider of the Commercial Banking & Credit Analyst (CBCA)™Program Page - CBCAGet CFI's CBCA™ certification and become a Commercial Banking & Credit Analyst. Enroll and advance your career with our certification programs and courses. certification program, designed to transform anyone into a world-class financial analyst.
To keep learning and developing your knowledge of financial analysis, we highly recommend the additional resources below:
- Head and Shoulders PatternHead and Shoulders Pattern – Technical AnalysisThe head and shoulders is a pattern commonly seen in trading charts. The head and shoulders pattern is a predicting chart formation that usually indicates a reversal in trend where the market makes a shift from bullish to bearish, or vice-versa.
- MACD OscillatorMACD Oscillator - Technical AnalysisThe MACD Oscillator is used to examine short-term moving average convergence and divergence. The MACD Oscillator is a double-edged technical indicator in that it offers traders and analysts the ability to follow trends in the market, as well as gauge the momentum of price changes.
- Zig Zag IndicatorZig Zag Indicator - Technical AnalysisThe zig zag indicator is a common technical analysis pattern used to filter out insignificant fluctuations in the price of a security and accurately track the existing trend . The zig zag indicator is, however, a very lagging type of indicator.
- Technical AnalysisTechnical Analysis - A Beginner's GuideTechnical analysis is a form of investment valuation that analyses past prices to predict future price action. Technical analysts believe that the collective actions of all the participants in the market accurately reflect all relevant information, and therefore, continually assign a fair market value to securities.
-

Covered Calls: A Comprehensive Guide for Investors
A covered call is a risk management and an options strategy that involves holding a long position in the underlying asset (e.g., stockStockWhat is a stock? An individual who owns stock in a company is
-
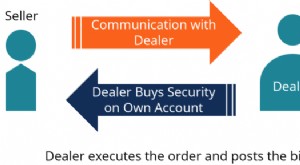
Understanding Dealer Markets: How Market Makers Function
A dealer market is a financial market where dealers post prices they would be willing to buy and sell specific securitiesTrading SecuritiesTrading securities are securities purchased by a company for
invest
- Price Channels: Understanding & Trading Strategies
- Understanding Divergence in Technical Analysis: A Guide
- Understanding Forward Prices: Definition & How They Work
- Understanding Hedging Strategies: A Comprehensive Guide
- Understanding Horizontal Channels in Trading: A Comprehensive Guide
- Understanding Slippage in Trading: Causes & Impact
- Understanding Strangle Options: A Comprehensive Guide
- Trading Channels: Understanding Uptrends & Downtrends
- Understanding Volatility: A Key Indicator of Investment Risk
-
 Call Warrants: Understanding Rights & Investment Potential
A call warrant gives the holder of the investment the right, not the obligation, to purchase the underlying financial securities at a specific price on or before a certain date.If the holder does not ...
-
 Commodity Valuation: Understanding Intrinsic Value & Market Pricing
Commodity valuation is the process of deriving the intrinsic value of a commodity under optimal market conditions. In a perfectly competitive free market, the price of a commodity reflects the intrins...