Profitability Index (PI): Definition, Formula & Investment Ranking
The Profitability Index (PI) measures the ratio between the present value of future cash flows and the initial investment. The index is a useful tool for ranking investment projects and showing the value created per unit of investment.
The Profitability Index is also known as the Profit Investment Ratio (PIR) or the Value Investment Ratio (VIR).

Profitability Index Formula
The formula for the PI is as follows:

or

Therefore:
- If the PI is greater than 1, the project generates value and the company may want to proceed with the project.
- If the PI is less than 1, the project destroys value and the company should not proceed with the project.
- If the PI is equal to 1, the project breaks even and the company is indifferent between proceeding or not proceeding with the project.
The higher the profitability index, the more attractive the investment.
Example of Profitability Index
Company A is considering two projects:
Project A requires an initial investment of $1,500,000 to yield estimated annual cash flowsStatement of Cash FlowsThe Statement of Cash Flows (also referred to as the cash flow statement) is one of the three key financial statements that report the cash of:
- $150,000 in Year 1
- $300,000 in Year 2
- $500,000 in Year 3
- $200,000 in Year 4
- $600,000 in Year 5
- $500,000 in Year 6
- $100,000 in Year 7
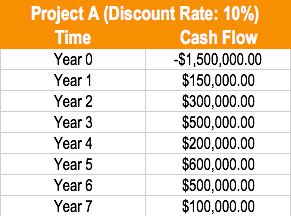
The appropriate discount rate for this project is 10%.
Project B requires an initial investment of $3,000,000 to yield estimated annual cash flows of:
- $100,000 in Year 1
- $500,000 in Year 2
- $1,000,000 in Year 3
- $1,500,000 in Year 4
- $200,000 in Year 5
- $500,000 in Year 6
- $1,000,000 in Year 7
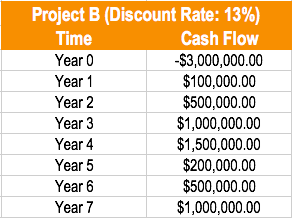
The appropriate discount rate for this project is 13%.
Company A is only able to undertake one project. Using the profitability index method, which project should the company undertake?
Using the PI formula, Company A should do Project A. Project A creates value – Every $1 invested in the project generates $.0684 in additional value.
Discounting the Cash Flows of Project A:
- $150,000 / (1.10) = $136,363.64
- $300,000 / (1.10)^2 = $247,933.88
- $500,000 / (1.10)^3 = $375,657.40
- $200,000 / (1.10)^4 = $136,602.69
- $600,000 / (1.10)^5 = $372,552.79
- $500,000 / (1.10)^6 = $282,236.97
- $100,000 / (1.10)^7 = $51,315.81
Present value of future cash flows:
$136,363.64 + $247,933.88 + $375,657.40 + $136,602.69 + $372,552.79 + $282,236.97 + $51,315.81 = $1,602,663.18
Profitability index of Project A: $1,602,663.18 / $1,500,000 = $1.0684. Project A creates value.
Discounting the Cash Flows of Project B:
- $100,000 / (1.13) = $88,495.58
- $500,000 / (1.13)^2 = $391,573.34
- $1,000,000 / (1.13)^3 = $693,050.16
- $1,500,000 / (1.13)^4 = $919,978.09
- $200,000 / (1.13)^5 = $108,551.99
- $500,000 / (1.13)^6 = $240,159.26
- $1,000,000 / (1.13)^7 = $425,060.64
Present value of future cash flows:
$88,495.58 + $391,573.34 + $693,050.16 + $919,978.09 + $108,551.99 + $240,159.26 + $425,060.64 = $2,866,869.07
Profitability index of Project B: $2,866,869.07 / $3,000,000 = $0.96. Project B destroys value.
Download the Free Template
Enter your name and email in the form below and download the free template now!
Advantages of the Profitability Index
- The profitability index indicates whether an investment should create or destroy company value.
- It takes into consideration the time value of money and the risk of future cash flowsCash FlowCash Flow (CF) is the increase or decrease in the amount of money a business, institution, or individual has. In finance, the term is used to describe the amount of cash (currency) that is generated or consumed in a given time period. There are many types of CF through the cost of capital.
- It is useful for ranking and choosing between projects when capital is rationed.
Example: A company allocates $1,000,000 to spend on projects. The initial investment, present value, and profitability index of these projects are as follows:
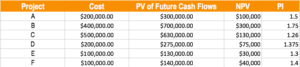
The incorrect way to solve this problem would be to choose the highest NPV projects: Projects B, C, and F. This would yield an NPV of $470,000.
The correct way to solve this problem would be to choose the projects starting from the highest profitability index until cash is depleted: Projects B, A, F, E, and D. This would yield an NPV of $545,000.
Disadvantages of the Profitability Index
- The profitability index requires an estimate of the cost of capital to calculate.
- In mutually exclusive projects where the initial investments are different, it may not indicate the correct decision.
Related Readings
Thank you for reading this CFI guide. To continue learning, you may find the CFI resources listed below helpful. CFI’s mission is to help anyone advance their career through the Financial Modeling & Valuation Analyst (FMVA)®Become a Certified Financial Modeling & Valuation Analyst (FMVA)®CFI's Financial Modeling and Valuation Analyst (FMVA)® certification will help you gain the confidence you need in your finance career. Enroll today! program.
- Adjusted Present ValueAdjusted Present Value (APV)Adjusted Present Value (APV) of a project is calculated as its net present value plus the present value of debt financing side effects.
- Discounted Cash Flow (DCF) FormulaDiscounted Cash Flow DCF FormulaThis article breaks down the DCF formula into simple terms with examples and a video of the calculation. Learn to determine the value of a business.
- Profitability RatiosProfitability RatiosProfitability ratios are financial metrics used by analysts and investors to measure and evaluate the ability of a company to generate income (profit) relative to revenue, balance sheet assets, operating costs, and shareholders' equity during a specific period of time. They show how well a company utilizes its assets to produce profit
- Valuation MethodsValuation MethodsWhen valuing a company as a going concern there are three main valuation methods used: DCF analysis, comparable companies, and precedent transactions
-

Profitability Index (PI): A Comprehensive Guide
What Is the Profitability Index (PI)? The profitability index (PI), alternatively referred to as value investment ratio (VIR) or profit investment ratio (PIR), describes an index that represent
-

Allowance for Doubtful Accounts: Definition & Purpose
The allowance for doubtful accounts is a contra-asset account that is associated with accounts receivableAccounts ReceivableAccounts Receivable (AR) represents the credit sales of a business, which ha
Accounting
- Advance-Decline Line: Understanding Market Sentiment & Trends
- Capitalization-Weighted Index (CWI): Explained
- EAFE Index: Understanding Developed Market Performance
- Nikkei Index: Understanding Japan's Top Stock Market Indicator
- Price-Weighted Index Explained: How It Works & Examples
- Understanding the Completed Contract Method: Revenue Recognition Explained
- Consolidation Method Explained: A Comprehensive Guide
- Percentage of Completion Method: Accounting Explained
- Understanding the S&P 500: Top Holdings & Long-Term Performance
-
 Russell 2000 Index: Understanding Small-Cap Stocks & Investment
The Russell 2000 index is a financial index that is commonly used in the stock market today. Here are the basics of the Russell 2000 index and why it is important. The Russell 2000 Index T...
-
Meebits: Understanding the Ethereum NFT Collection
The Meebits are a collection 20,000 pixelated characters based on the Ethereum blockchain. Like other crypto art collections, they’re NFTs, or non-fungible tokens—one-of-a-kind cryptocurrency tokens t...