Understanding Same-Store Sales: A Key Retail Performance Indicator
Same-store sales, also known as comparable-store sales, is a financial metric commonly used by companies in the retail industry to evaluate the performance of existing stores.

Importance of Same-Store Sales
To understand why the same-store sales metric is disclosed, consider the following example:
Although the company’s revenues increased year-over-yearYoY (Year over Year)YoY stands for Year over Year and is a type of financial analysis used for comparing time series data. It is useful for measuring growth and detecting trends., the company added new stores. A significant question by analysts would be: “Is the increase in revenues due to existing stores or new stores?”
Therefore, the same-store sales metric is used to provide readers of financial statementsThree Financial StatementsThe three financial statements are the income statement, the balance sheet, and the statement of cash flows. These three core statements are with greater information. By providing the same-store sales metric, analysts can determine how well existing locations are performing.
In fact, investors and analysts often keep a close eye on same-store sales due to it being a strong predictor of the health of retail operations and future success of a company. For analysts, same-store sales for retail companies often holds as much importance as the revenue and earnings numbers.
Formula for Same-Store Sales

Where:
- Total Sales refers to the total sales generated from the company’s stores; and
- Total SalesT+1 refers to the total sales generated in the next period (next month, quarter, etc.) from the company’s stores in the preceding period.
Example of Same-Store Sales
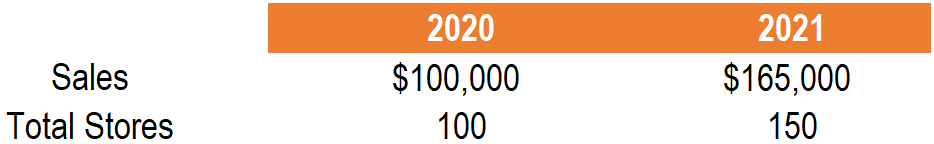
An analyst is looking to determine the same-store sales for a company. The analyst noted that the company operated 100 stores that generated total sales of $100,000 in 2020. In 2021, the company added 50 new stores, with management noting that each store contributed $1,100 in sales for a total sale of $165,000. The information is illustrated below:

What is the same-store sales number for the company?
In 2020, the 100 stores generated sales of $100,000. In 2021, each store generated sales of $1,000. Using the same number of stores in 2020, the total sales amount to $110,000 in 2021 for the same stores. Therefore, same-store sales are calculated as:
Same-store sales = ($110,000 / $100,000 – 1) x 100 = 10%
How to Interpret
A positive (>0%) same-store sales figure is favorable, while a decrease (<0%) in same-store sales is detrimental. A positive same-store sales figure means that the company generated more sales per store compared to last year – an indicator of growing customer demandTypes of CustomersCustomers play a significant role in any business. By better understanding the different types of customers, businesses can be better equipped to develop. On the other hand, a negative same-store sales figure means that the company generated fewer sales per store – an indicator of deteriorating customer demand.
However, this is not to say that a positive same-store sale is always favorable. The metric must be compared to an expectation. As we will see in the example below, a positive same-store sales figure does not necessarily translate to a strong-performing company.
Same-Store Sales in the News
On July 16, 2019, Domino’s Pizza reported its quarterly earnings. Among other things, the company reported same-store sales of 2.1% for US stores, 3.1% for US franchise stores, and 2.4% for international stores. The company’s same-store sales were below analyst expectations. As a result, shares of Domino’s plummeted after its earnings announcement.
As shown in the example above, although Domino’s Pizza reported positive same-store sales, that alone does not necessarily indicate that the company is doing well. The ratio must be compared to a benchmark or analyst expectations. If analysts expect same-store sales for a company to increase 15%, but the company only delivered 5%, it would indicate a weak-performing company.
More Resources
CFI offers the Financial Modeling & Valuation Analyst (FMVA)Become a Certified Financial Modeling & Valuation Analyst (FMVA)®CFI's Financial Modeling and Valuation Analyst (FMVA)® certification will help you gain the confidence you need in your finance career. Enroll today!®Become a Certified Financial Modeling & Valuation Analyst (FMVA)®CFI's Financial Modeling and Valuation Analyst (FMVA)® certification will help you gain the confidence you need in your finance career. Enroll today! certification program for those looking to take their careers to the next level. To keep learning and developing your knowledge base, please explore the additional relevant CFI resources below:
- Buyer TypesBuyer TypesBuyer types is a set of categories that describe spending habits of consumers. Consumer behavior reveals how to appeal to people with different habits
- Product LineProduct LineA product line refers to an array of related products under the same brand. In other words, a product line is a collection of similar products that are sold
- Retail Industry Comps TemplateRetail Industry Comps TemplateThis free retail industry comps template allows the user to perform a simple comparable company analysis within the retail industry.
- Sales per Square FootSales per Square FootSales per square foot is a metric commonly used by retail companies to determine the amount of revenue generated per square foot of retail
-

Understanding Beauty Product Sales Commissions: What's Reasonable?
Many beauty consultants are paid on commission. Buying beauty products can be difficult because of the many brands. Beauty product consultants help individuals find the right beauty products
-
![Sales Forecasting: Purposes, Methods & Benefits | [Your Company Name]](https://www.etffin.com/article/uploadfiles/202109/2021092608475976_S.jpg)
Sales Forecasting: Purposes, Methods & Benefits | [Your Company Name]
A smiling man pointing to a sales chart. Sales are recorded on a company's income statement, which summarizes the company's financial performance over a given period with respect to p
Accounting
- Total Sales Revenue: Definition & Importance | [Your Company Name]
- Understanding Credit Sales: Definition & Benefits | CFI
- Days Sales Outstanding (DSO): Definition & Calculation
- Understanding Direct Cost of Sales (COGS): Definition & Components
- Gross Profit Explained: Definition, Calculation & Importance
- Understanding Intersegment Sales: Definition & Reporting
- Understanding Net Sales: Definition & Importance
- Sales Revenue: Definition, Calculation & Importance
- Channel Stuffing: Definition, Risks & How to Avoid It
-
 Understanding the Sales and Collection Cycle: A Comprehensive Guide
The Sales and Collection Cycle, also known as the Revenue, Receivables, and Receipts (RRR) Cycle, is composed of various classes of transactions. The sales class and receipts class of transactions are...
-
 Tax-Free Weekend 2024: What You Need to Know
This article was fact-checked by our editors and a member of the Credit Karma Tax® product specialist team, led by Senior Manager of Operations Christina Taylor. Whoever said taxe...