Understanding Degree of Operating Leverage (DOL): A Comprehensive Guide
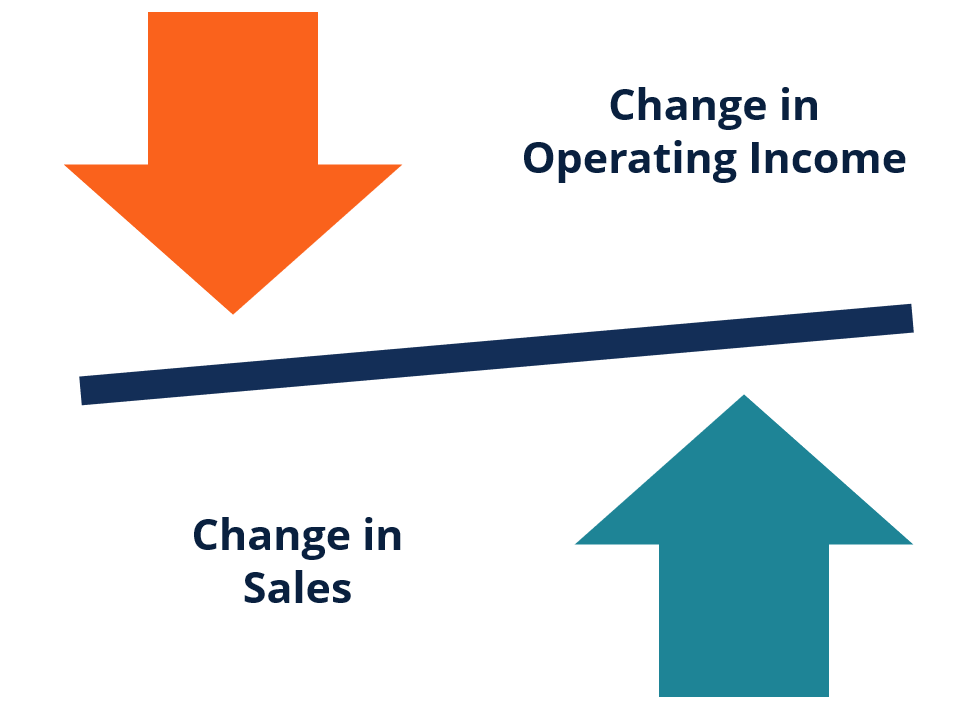
The degree of operating leverage (DOL) is a financial ratio that measures the sensitivity of a company’s operating incomeOperating IncomeOperating income is the amount of revenue left after deducting the operational direct and indirect costs from sales revenue. to its sales. This financial metric shows how a change in the company’s sales will affect its operating income.
Breaking Down Degree of Operating Leverage
The degree of operating leverage is a method used to quantify a company’s operating risk. This risk arises due to the structure of fixed and variable costsFixed and Variable CostsCost is something that can be classified in several ways depending on its nature. One of the most popular methods is classification according. Fixed costs do not allow the company to adjust its operating costs. Therefore, operating risk rises with an increase in the fixed-to-variable costs proportion.
Generally, a low DOL indicates that the company’s variable costs are larger than its fixed costs. That implies that a significant increase in the company’s salesSales RevenueSales revenue is the income received by a company from its sales of goods or the provision of services. In accounting, the terms "sales" and will not lead to a substantial increase in its operating income. At the same time, the company does not need to cover large fixed costs.
A high DOL reveals that the company’s fixed costs exceed its variable costs. It indicates that the company can boost its operating income by increasing its sales. In addition, the company must be able to maintain relatively high sales to cover all fixed costs.
Formula for Degree of Operating Leverage
The degree of operating leverage can be calculated in several different ways. First, we can use the formula from the definition of the ratio:

Since the operating leverage ratio is closely related to the company’s cost structureCost StructureCost structure refers to the types of expenses that a business incurs, and is typically composed of fixed and variable costs. Fixed costs remain unchanged, we can calculate it using the company’s contribution margin. The contribution margin is the difference between total sales and total variable costs.
Finally, if there is available information about the cost structure of a company, we can use the following formula:
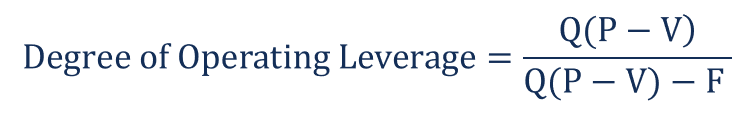
Where:
- Q – the number of units
- P – the price per unit
- V – the variable cost per unit
- F – the fixed costs
Example
The management of ABC Corp. wants to determine the company’s current degree of operating leverage. The company sells 10,000 product units at an average price of $50. The variable cost per unit is $12, while the total fixed costs are $100,000.
The company’s DOL is:
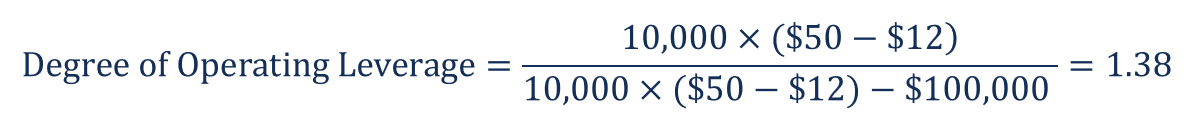
The DOL indicates that every 1% change in the company’s sales will change the company’s operating income by 1.38%.
Related Readings
We hope you’ve enjoyed reading CFI’s explanation of the degree of operating leverage. CFI offers the Financial Modeling & Valuation Analyst (FMVA)™Become a Certified Financial Modeling & Valuation Analyst (FMVA)®CFI's Financial Modeling and Valuation Analyst (FMVA)® certification will help you gain the confidence you need in your finance career. Enroll today! certification program for those looking to take their careers to the next level. To keep learning and advancing your career, the following CFI resources will be helpful:
- Contribution MarginContribution MarginContribution margin is a business’ sales revenue less its variable costs. The resulting contribution margin can be used to cover its fixed
- Debt to Assets RatioDebt to Assets RatioThe Debt to Assets Ratio is a leverage ratio that helps quantify the degree to which a company's operations are funded by debt. In many cases, a high leverage ratio is also indicative of a higher degree of financial risk. This is because a company that is heavily leveraged faces a higher chance of defaulting on its loans.
- Forecasting Finance (Equity, Debt, Interest)Forecasting Finance (Equity, Debt, Interest)This article on forecasting finance is part three of the four-step financial forecasting model in Excel. This guide explains how to model debt and interest
- Leverage RatiosLeverage RatiosA leverage ratio indicates the level of debt incurred by a business entity against several other accounts in its balance sheet, income statement, or cash flow statement. Excel template
-

Understanding the Operating Cash Flow Ratio: A Key Liquidity Metric
The Operating Cash Flow Ratio, a liquidity ratio, is a measure of how well a company can pay off its current liabilitiesCurrent LiabilitiesCurrent liabilities are financial obligations of a business e
-
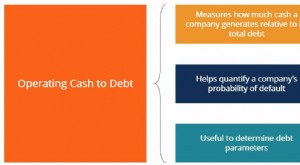
Operating Cash to Debt Ratio: Understanding Financial Health
The Operating Cash to Debt Ratio measures the percentage of a company’s total debt that is covered by its operating cash flow for a given accounting period. The operating cash flow refers to the
finance
- Acid-Test Ratio: Understanding Your Company's Short-Term Liquidity
- Financial Leverage: Definition, Calculation & Impact on Profitability
- Understanding Total Leverage: A Comprehensive Guide
- Understanding the Earnings Multiplier (P/E Ratio): A Comprehensive Guide
- Financial Leverage Explained: Using Debt for Growth
- Understanding the IPO Process: A Comprehensive Guide
- Leverage in Finance: Strategies, Types & Risks
- Modigliani-Miller Theorem: Understanding Capital Structure & Firm Value
- Operating Ratio: Definition, Calculation & Importance
-
 Understanding Investor Influence & Key Investment Methods
The level of investor influence a company holds in an investment transactionInvestment MethodsThis guide and overview of investment methods outlines they main ways investors try to make money and mana...
-
 Net Debt to EBITDA Ratio: Understanding Company Solvency
The net debt-to-EBITDA ratio measures a company’s ability to pay off its liabilities. It shows how much time the company needs to operate at the current debt and EBITDA levels to pay all of its ...