Operating Cash to Debt Ratio: Understanding Financial Health
The Operating Cash to Debt Ratio measures the percentage of a company’s total debt that is covered by its operating cash flow for a given accounting period. The operating cash flow refers to the cash that a company generates through its core operating activities. This usually represents the biggest stream of cash that a company generates.
The Operating Cash to Debt Ratio can be used to assess a company’s probability of defaulting on its interest payments. Generating a lot of cash relative to how much debt a company has indicates the company is well-positioned to repay its debts. It is thus deemed a safer debt investment by creditors.
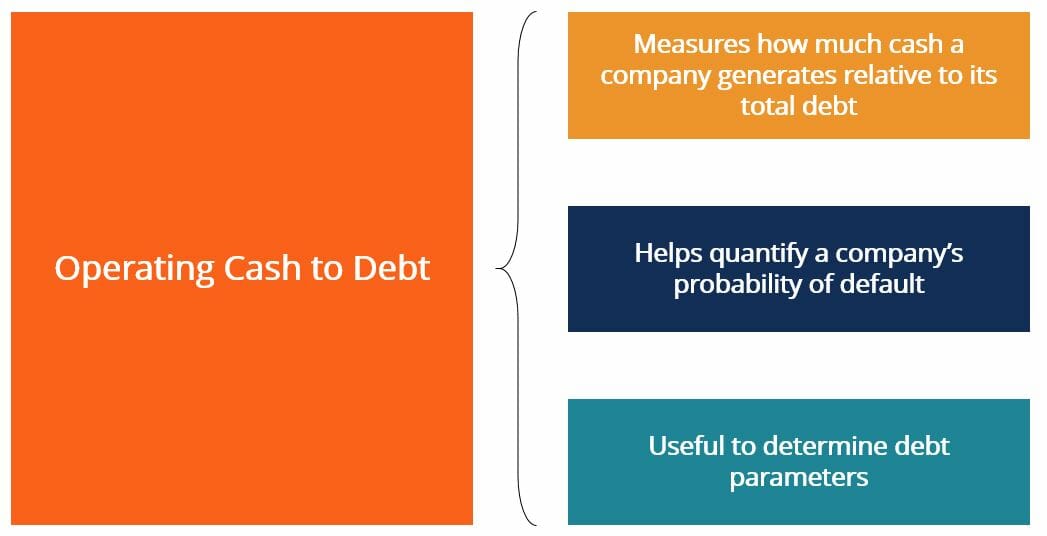
A high ratio indicates a company likely has a lower probability of defaulting on its loans, making it a safer investment opportunity for debt providers. Conversely, a low ratio indicates the company has a higher chance of defaulting, as it has less cash available to dedicate to debt repayment.
How can we calculate the Operating Cash to Debt Ratio?
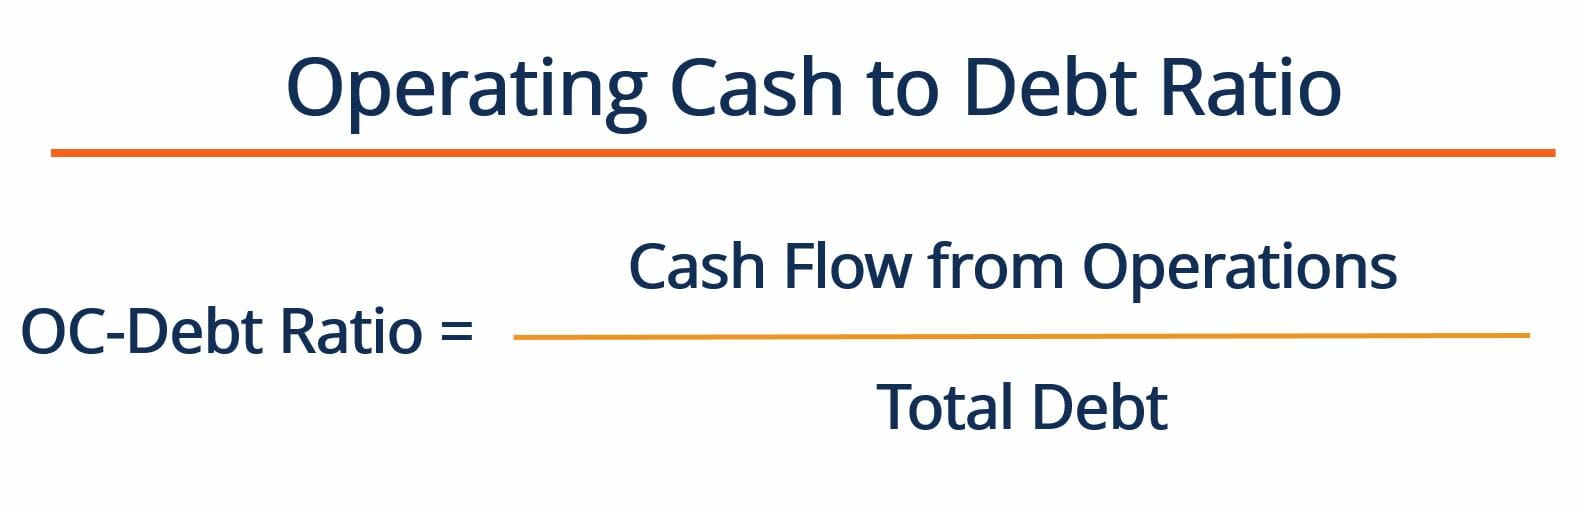
The Operating Cash to Debt ratio is calculated by dividing a company’s cash flow from operations by its total debt. The formula to calculate the ratio is as follows:
Where:
Cash Flow from Operations – refers to the cash flow that the business generates through its operating activities. This number can be found on a company’s cash flow statement
Total Debt – refers to the total debt that a company has. This can be found by adding up the company’s short-term and long-term debt. Both of these figures can be found on the company’s balance sheet.
Generally speaking, a high OC to Debt ratio indicates that a company is fairly mature, as it is generating a lot of cash from operating activities. This contrasts with startups, which often rely on financing to generate cash flows (i.e., are not yet self-sustaining). Debt providers typically prefer to lend money to companies with a high OC to Debt ratio. As noted, such companies generate steady cash flows from operations and are likely not over-leveraged.
Operating Cash to Debt Ratio Example
Bill’s Baguette’s wants to calculate its Operating Cash to Debt Ratio to gain a better understanding of where it stands in the industry with regard to cash flow generation. Below are snippets from the business’ financial statements:
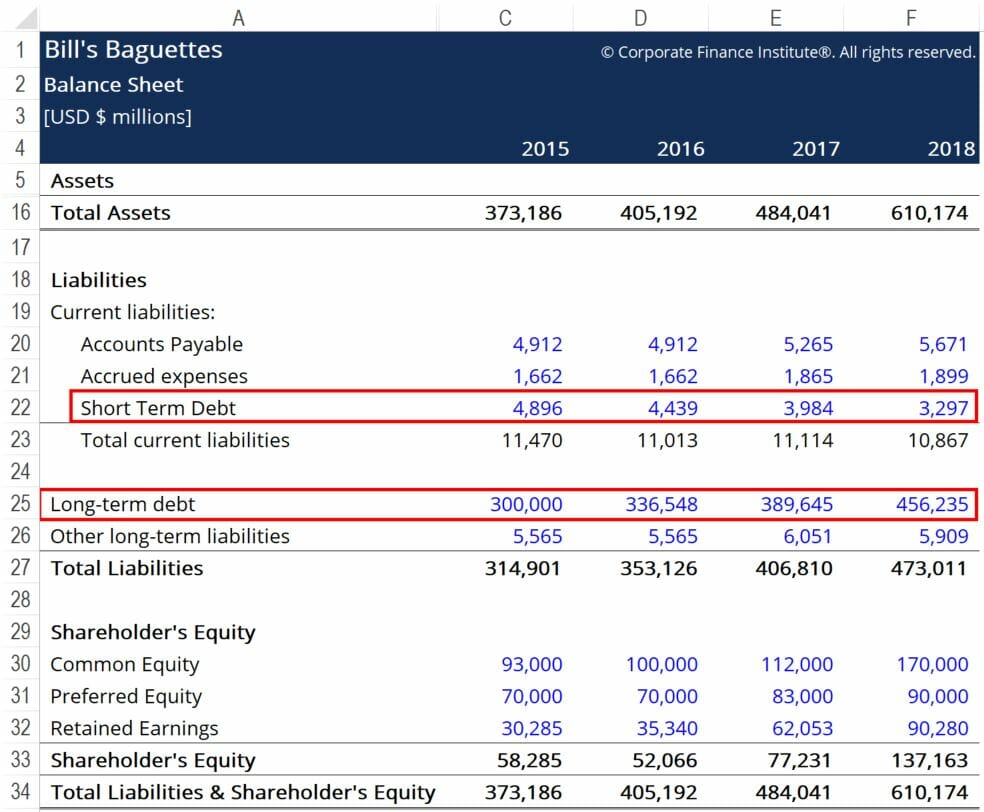
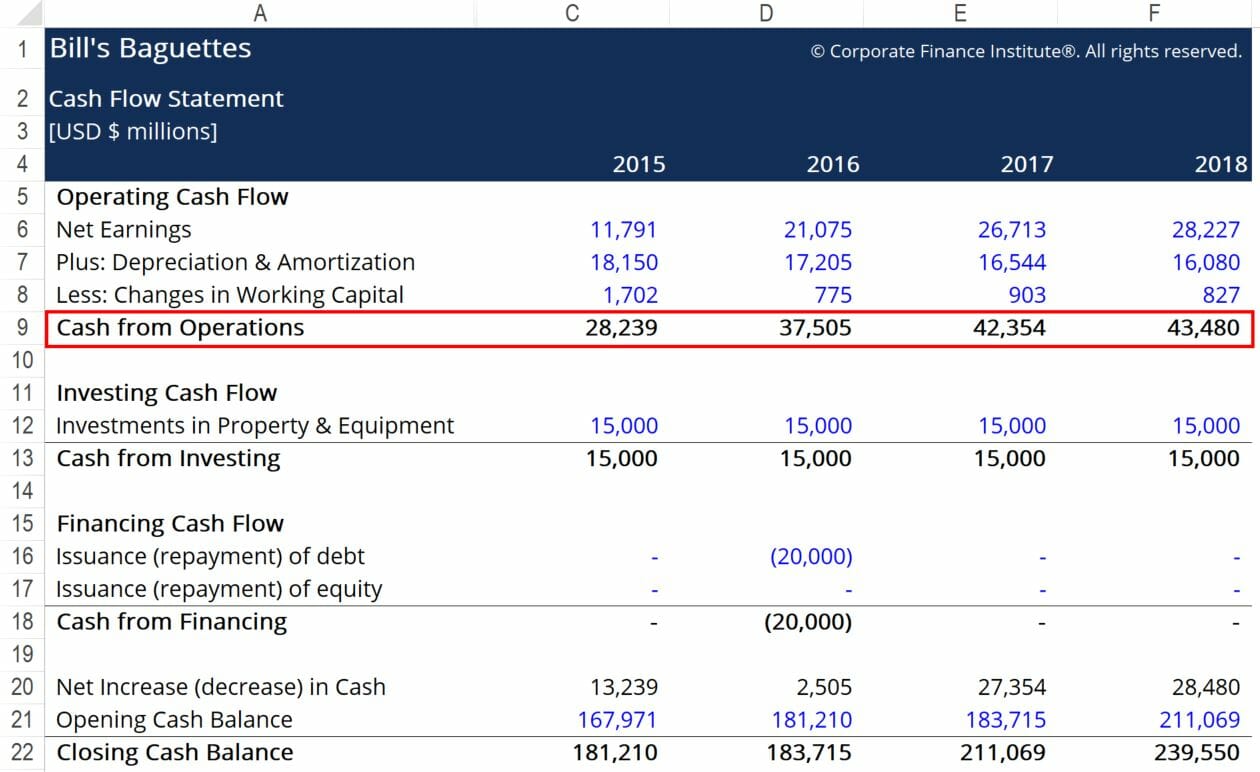
The red boxes highlight the important information we need to calculate Operating Cash to Debt. The required numbers are short-term debt, long-term debt, and cash flow from operations. Using the formula provided above, we arrive at the following figures:
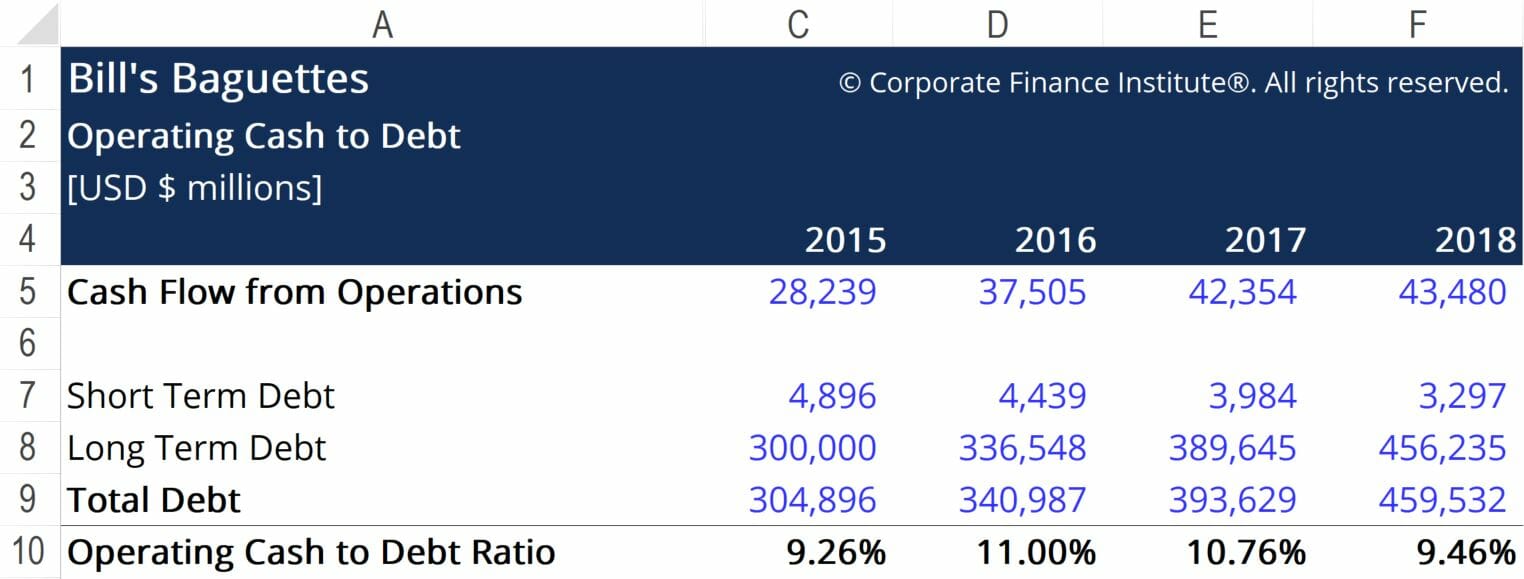
Here, we see that Bill’s OC to Debt Ratio hovers around the 10% mark. This means that should Bill’s choose to dedicate all the cash earned from operating activities toward repaying its debt, it would be able to pay off 10% of the total. While it is likely not wise to utilize cash in such a way, the measure does provide some context as to where the business stands vis-a-vis its debt and cash situation.
To better understand the financial health of the business, the Operating Cash to Debt ratio should be compared to the figures for a number of companies operating in the same industry. If some other firms operating in the industry see OC-Debt percentages that are, on average, lower than Bill’s, we can conclude that Bill’s is doing a relatively good job of managing its financial leverage. In turn, creditors may be more likely to lend more money to Bill’s because the company represents a relatively safe investment within the baguette industry.
Additional Resources
Thank you for reading this CFI article on Operating Cash to Debt Ratio! CFI offers the Financial Modeling & Valuation Analyst (FMVA)™Become a Certified Financial Modeling & Valuation Analyst (FMVA)®CFI's Financial Modeling and Valuation Analyst (FMVA)® certification will help you gain the confidence you need in your finance career. Enroll today! certification program for those looking to take their careers to the next level. To learn more about related topics, check out the following CFI resources:
- How to Calculate Debt Service Coverage RatioHow to Calculate Debt Service Coverage RatioThis guide will describe how to calculate the Debt Service Coverage Ratio. First, we will go over a brief description of the Debt Service Coverage Ratio, why it is important, and then go over step-by-step solutions to several examples of Debt Service Coverage Ratio Calculations.
- Current Portion of Long-Term DebtCurrent Portion of Long-Term DebtThe current portion of long-term debt is the portion of long-term debt due that is due within a year’s time. Long-term debt has a maturity of
- Accounting Fundamentals Course – CFI
- Defensive Interval RatioDefensive Interval RatioThe defensive interval ratio (DIR) is a financial liquidity ratio that indicates how many days a company can operate without needing to tap into capital sources other than its current assets. It is also known as the basic defense interval ratio (BDIR) or the defensive interval period ratio (DIPR).
-

Reserve Ratio Explained: Understanding Bank Reserves
The reserve ratio – also known as bank reserve ratio, bank reserve requirement, or cash reserve ratio – is the percentage of deposits a financial institution must hold in reserve as cash.
-

Understanding the Retention Ratio: Reinvesting for Growth
The retention ratio (also known as the net income retention ratio) is the ratio of a company’s retained income to its net incomeNet IncomeNet Income is a key line item, not only in the income st
finance
- Cash Conversion Ratio (CCR): Definition & Importance
- Cash Flow to Debt Ratio: Understanding and Calculation
- Cash Ratio: Understanding Your Company's Short-Term Liquidity
- Cash Turnover Ratio (CTR): Calculation & Interpretation
- Debt-to-Assets Ratio: Definition, Calculation & Risk Assessment
- Debt-to-Equity Ratio: Definition, Calculation & Importance
- Understanding the Operating Cash Flow Ratio: A Key Liquidity Metric
- Operating Cash to Total Cash Ratio: Meaning & Significance
- Operating Ratio: Definition, Calculation & Importance
-
 Current Ratio: Definition, Calculation & Financial Health
The current ratio, also known as the working capitalNet Working CapitalNet Working Capital (NWC) is the difference between a companys current assets (net of cash) and current liabilities (net of debt)...
-
 Quick Ratio: Understanding Your Business's Short-Term Liquidity
The Quick Ratio, also known as the Acid-test or Liquidity ratio, measures the ability of a business to pay its short-term liabilities by having assets that are readily convertible into cashCash Equiva...