Understanding Total Leverage: A Comprehensive Guide
The degree of total leverage is a ratio that compares the rate of change a company experiences in earnings per share (EPS)Earnings Per Share (EPS)Earnings per share (EPS) is a key metric used to determine the common shareholder's portion of the company’s profit. EPS measures each common share's profit to the rate of change it experiences in revenue from sales.
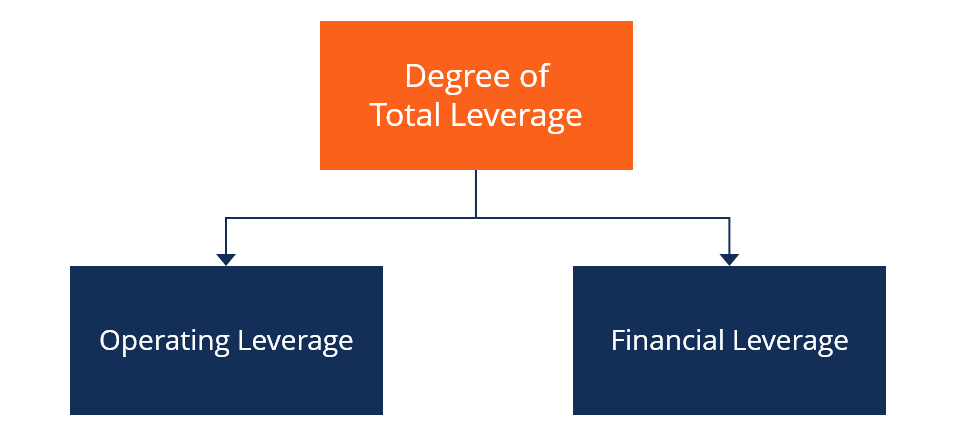
The degree of total leverage can also be referred to as the “degree of combined leverage” because it considers the effects of both operating leverage and financial leverageFinancial LeverageFinancial leverage refers to the amount of borrowed money used to purchase an asset with the expectation that the income from the new asset will exceed the cost of borrowing..
Components of the Degree of Total Leverage
The two leverages that degree of total leverage accounts for are as follows:
- Operating leverage – This part of a company’s fixed costs reveals how effectively revenue from sales is translated into operating incomeOperating IncomeOperating income is the amount of revenue left after deducting the operational direct and indirect costs from sales revenue.. A business with a high level of operating leverage can increase its bottom line significantly with just a relatively small increase in revenues because it has effectively leveraged its operating costs so as to maximize profits.
- Financial leverage – Financial leverage is a metric used to evaluate the extent to which a company uses debt to increase its assets and net incomeNet IncomeNet Income is a key line item, not only in the income statement, but in all three core financial statements. While it is arrived at through. Examining a company’s financial leverage shows the impact on earnings per share of changes in EBIT that result from taking on additional debt.
Calculating Degree of Total Leverage
The degree of total leverage can be explained or calculated simply as:
Degree of total leverage = Degree of operating leverage x Degree of financial leverage =
The degree of operating leverage is equivalent to:
Contribution margin (Total sales – Variable costs) / Earnings before interest and taxes (EBIT)
The degree of financial leverage is equivalent to:
Earnings before interest and taxes (EBIT) / EBIT – interest expenses
Example of Degree of Total Leverage
Let’s put the degree of total leverage into practice by looking at an example. Assume that Company ABC’s current EPS is $3, and it is trying to determine what its new EPS will be in the event that it experiences a 10% increase in sales revenueSales RevenueSales revenue is the income received by a company from its sales of goods or the provision of services. In accounting, the terms "sales" and.
For our example, also assume the following for Company ABC:
- Contribution margin is $15 million
- Fixed costs are $3 million
- Interest expenses are $1.5 million
The first step in determining Company ABC’s new EPS is to calculate the percentage of response that the current EPS will experience with a 1% change in revenue from sales, which is also equal to the degree of operating leverage. The calculation should look something like this:
$15m/$15m – $3m (1.25) x $15m – $3m / $15m – $3m – $1.5m (1.14) =
1.25 x 1.14 = 1.43%
The degree of total leverage for Company ABC is 1.43%. The figure can then be used to help the company determine what its new EPS will be if it sees a 10% increase in sales revenue. The calculation for the new EPS should look like this:
$3 (current EPS) x (1 + 1.43 x 10%) = $3.49
Final Word
Determining a company’s degree of total leverage is important because it helps the company establish the type or percentage of change it can expect in its EPS in relation to an increase in sales revenue.
Understanding the changes or growth in earnings per share is important for any company because it helps corporate management evaluate the company’s performance and because it shows the income the company is earning for its shareholdersShareholderA shareholder can be a person, company, or organization that holds stock(s) in a given company. A shareholder must own a minimum of one share in a company’s stock or mutual fund to make them a partial owner..
Additional Resources
CFI offers the Financial Modeling & Valuation Analyst (FMVA)™Become a Certified Financial Modeling & Valuation Analyst (FMVA)®CFI's Financial Modeling and Valuation Analyst (FMVA)® certification will help you gain the confidence you need in your finance career. Enroll today! certification program for those looking to take their careers to the next level. To keep learning and advancing your career, the following CFI resources will be helpful:
- Coverage RatioCoverage RatioA Coverage Ratio is used to measure a company’s ability to pay its financial obligations. A higher ratio indicates a greater ability to meet obligations
- EV/EBITDAEV/EBITDAEV/EBITDA is used in valuation to compare the value of similar businesses by evaluating their Enterprise Value (EV) to EBITDA multiple relative to an average. In this guide, we will break down the EV/EBTIDA multiple into its various components, and walk you through how to calculate it step by step
- Leverage RatiosLeverage RatiosA leverage ratio indicates the level of debt incurred by a business entity against several other accounts in its balance sheet, income statement, or cash flow statement. Excel template
- Types of Valuation MultiplesTypes of Valuation MultiplesThere are many types of valuation multiples used in financial analysis. They can be categorized as equity multiples and enterprise value multiples.
-
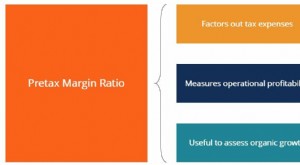
Pretax Margin Ratio: Definition & Analysis | Financial Insights
The Pretax Margin Ratio, also knows at the Earnings Before TaxEarnings Before Tax (EBT)Earnings before tax, or pre-tax income, is the last subtotal found in the income statement before the net income
-
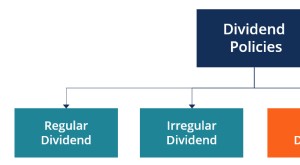
Understanding Stable Dividend Policies: A Comprehensive Guide
A business with a stable dividend policy pays out a steady dividend every given period, regardless of the volatilityVolatilityVolatility is a measure of the rate of fluctuations in the price of a secu
finance
- Acid-Test Ratio: Understanding Your Company's Short-Term Liquidity
- Financial Leverage: Definition, Calculation & Impact on Profitability
- Understanding Degree of Operating Leverage (DOL): A Comprehensive Guide
- Understanding the Earnings Multiplier (P/E Ratio): A Comprehensive Guide
- Financial Leverage Explained: Using Debt for Growth
- Understanding the IPO Process: A Comprehensive Guide
- Leverage in Finance: Strategies, Types & Risks
- Modigliani-Miller Theorem: Understanding Capital Structure & Firm Value
- Understanding Total Addressable Market (TAM): A Comprehensive Guide
-
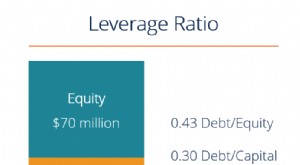 Leverage Ratios: Understanding Financial Risk & Debt
A leverage ratio is any kind of financial ratioFinancial Analysis Ratios GlossaryGlossary of terms and definitions for common financial analysis ratios terms. Its important to have an understand...
-
 Net Debt to EBITDA Ratio: Understanding Company Solvency
The net debt-to-EBITDA ratio measures a company’s ability to pay off its liabilities. It shows how much time the company needs to operate at the current debt and EBITDA levels to pay all of its ...