Net Debt to EBITDA Ratio: Understanding Company Solvency
The net debt-to-EBITDA ratio measures a company’s ability to pay off its liabilities. It shows how much time the company needs to operate at the current debt and EBITDA levels to pay all of its debt.
The net debt-to-EBITDA ratio is similar to the debt-to-EBITDA ratio in that it measures the ability to pay short-term and long-term liabilities, but the net debt-to-EBITDA ratio also accounts for the cash and cash equivalentsCash EquivalentsCash and cash equivalents are the most liquid of all assets on the balance sheet. Cash equivalents include money market securities, banker's acceptances of the company.
Breaking Down the Net Debt-to-EBITDA Ratio
The net debt-to-EBITDA ratio is given by the following formula:

- The total debt of a company is given by the sum of the short-term and long-term liabilities, including accounts payableAccounts PayableAccounts payable is a liability incurred when an organization receives goods or services from its suppliers on credit. Accounts payables are, notes payable, mortgages, and any other types of debt that the company may have taken on. The net debt refers to the company’s debt after accounting for the cash and cash equivalent reserves since they are the most liquid assets of the company.
- EBITDA refers to the sum of the company’s earnings before interest, taxes, depreciation, and amortization. It is used to gauge the company’s financial status and profitability.
Applications of the Net Debt-Tt-EBITDA Ratio
Higher net debt-to-EBITDA ratios indicate that the company may face difficulties in paying off their financial liabilities, based on their liquid assets and EBITDAEBITDAEBITDA or Earnings Before Interest, Tax, Depreciation, Amortization is a company's profits before any of these net deductions are made. EBITDA focuses on the operating decisions of a business because it looks at the business’ profitability from core operations before the impact of capital structure. Formula, examples. The ratio is often used by credit rating agencies, potential investors, as well as corporate buyers (i.e., for a merger or a takeover) to assess the financial status of the company.
Generally, net debt-to-EBITDA ratios of less than 3 are considered acceptable. The lower the ratio, the higher the probability of the firm successfully paying off its debt. Ratios higher than 3 or 4 serve as “red flags” and indicate that the company may be financially distressed in the future.
However, at the same time, it is important to note that the net debt-to-EBITDA ratio is not the single most reliable indicator of a company’s financial situation and profitability. For example, if the company recently invested in property, plant, and equipment (PP&E), the debt for the year is likely to be high.
The investment may produce higher sales in the next fiscal yearFiscal Year (FY)A fiscal year (FY) is a 12-month or 52-week period of time used by governments and businesses for accounting purposes to formulate annual, but the net debt-to-EBITDA ratio for the current fiscal year will be higher due to the increased debt. In this case, the ratio is not the most accurate or reliable indicator of what the company’s financial future looks like.
Practical Example
Consider the financial information obtained from BotPlant Corporation’s financial statements below:
• Cash: $50,000
• Cash Equivalents: $10,000
• EBITDA: $75,000
• Short-term Debt: $40,000
• Long-term Debt: $100,000
• Net Debt: $80,000
Based on the formula and the information provided, BotPlant’s net debt can be calculated as: ($40,0000 + $100,000) – ($50,000 + $10,000) = $80,000
Given the EBITDA, the net debt-to-EBITDA ratio can be calculated as follows:
$80,000 / $75,000 = 1.07
It is a relatively low net debt-to-EBITDA ratio and implies that the company may face little or no difficulty in paying off their liabilities at the current levels of earnings, cash, and debt.
More Resources
CFI is the official provider of the global Commercial Banking & Credit Analyst (CBCA)™Program Page - CBCAGet CFI's CBCA™ certification and become a Commercial Banking & Credit Analyst. Enroll and advance your career with our certification programs and courses. certification program, designed to help anyone become a world-class financial analyst. To keep advancing your career, the additional CFI resources below will be useful:
- Current LiabilitiesCurrent LiabilitiesCurrent liabilities are financial obligations of a business entity that are due and payable within a year. A company shows these on the
- EBIT vs. EBITDAEBIT vs EBITDAEBIT vs EBITDA - two very common metrics used in finance and company valuation. There are important differences, pros/cons to understand.
- Leverage RatiosLeverage RatiosA leverage ratio indicates the level of debt incurred by a business entity against several other accounts in its balance sheet, income statement, or cash flow statement. Excel template
- Notes PayableNotes PayableNotes payable are written agreements (promissory notes) in which one party agrees to pay the other party a certain amount of cash.
-

Fixed-Charge Coverage Ratio (FCCR): Definition & Importance
The Fixed-Charge Coverage Ratio (FCCR) is a measure of a company’s ability to meet fixed-charge obligations such as interest expensesInterest ExpenseInterest expense arises out of a company that
-

Solvency Ratio: Understanding a Company's Financial Stability
A solvency ratio is a performance metric that helps us examine a company’s financial health. In particular, it enables us to determine whether the company can meet its financial obligations in t
finance
- Acid-Test Ratio: Understanding Your Company's Short-Term Liquidity
- Asset Turnover Ratio: Definition & Calculation - Financial Analysis
- Debt-to-Asset Ratio: Definition, Calculation & Significance
- Net Debt to EBITDA Ratio: Understanding Financial Leverage
- Defensive Interval Ratio (DIR): Understanding Company Liquidity
- Understanding the Envy Ratio in Private Equity
- Pretax Margin Ratio: Definition & Analysis | Financial Insights
- Times Interest Earned (TIE) Ratio: Calculation & Interpretation
- Receivables Turnover Ratio: Definition, Calculation & Importance
-
 Understanding the Retention Ratio: Reinvesting for Growth
The retention ratio (also known as the net income retention ratio) is the ratio of a company’s retained income to its net incomeNet IncomeNet Income is a key line item, not only in the income st...
-
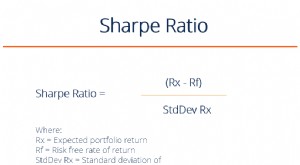 Sharpe Ratio: Calculate & Interpret Investment Performance
Named after American economist, William Sharpe, the Sharpe Ratio (or Sharpe Index or Modified Sharpe Ratio) is commonly used to gauge the performance of an investment by adjusting for its risk.The hig...