Understanding Market Capitalization: A Comprehensive Guide
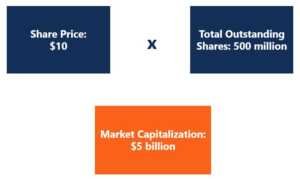
Market Capitalization (Market Cap) is the most recent market value of a company’s outstanding sharesWeighted Average Shares OutstandingWeighted average shares outstanding refers to the number of shares of a company calculated after adjusting for changes in the share capital over a reporting period. The number of weighted average shares outstanding is used in calculating metrics such as Earnings per Share (EPS) on a company's financial statements. The Market Cap is equal to the current share price multiplied by the number of shares outstanding.
The investing community often uses market capitalization value to rank companies and compare their relative sizes in a particular industry or sector. To determine a company’s market cap, simply take its current market share pricePar ValuePar Value is the nominal or face value of a bond, or stock, or coupon as indicated on a bond or stock certificate. It is a static value and multiply the figure by the total number of shares outstanding.

Market Capitalization Sample Calculation
Market Capitalization Categories
Broadly speaking, based on market capitalization, the stock market classifies stocks into various categories:
- Large Cap – Companies with a market cap above $10 billion are classified as large-cap stocks. Some examples would be Apple, Microsoft, IBM, Facebook, etc.
- Mid Cap – Companies whose market cap ranges from $1 billion to $10 billion. Mid-cap stocks, in general, are more volatile than large-cap stocks and consist more of growth-oriented stocks.
- Small Cap – Companies with a market capitalization between $250 million to $1 billion. They are high risk and high return stocks, as the companies are in the growth stageStock Investing: A Guide to Growth InvestingInvestors can take advantage of new growth investing strategies in order to more precisely hone in on stocks or other investments offering above-average growth potential.. A large number of companies belong to the small-cap category.
- Micro Cap – They are the penny stocks that are relatively young. The micro-cap companies’ potential for growth and decline are of similar nature. They are not considered to be the safest investment. Hence, they require lots of research before investment.
The table below shows the Market Capitalization of selected companies as of May 2021:
Name of the Company Sector Market Cap (Bn) Apple Inc.IT$2,080.8Alphabet Inc.IT$1,534.3Facebook Inc.IT$889.2Microsoft Corp.IT$1,831.1Amazon.comConsumer Discretionary$1,629.9Walmart Inc.Consumer Staples$399.3JP Morgan Chase & Co.Financials$487.7Goldman Sachs GroupFinancials$121.8Nike Inc.Footwear$210.1AT&T Inc.Telecom$206.8US Cellular Corp.Telecom$3.2
Investors can use a company’s classification and actual market capitalization value to make smart investment decisions. Generally, large-cap companies own more capital and assets than small-cap companies, and as such, are considered lower-risk investments than small-cap ones. Moreover, small-cap companies tend to show higher growth potential than their larger counterparts and, as such, are likely to provide investors with more opportunities for capital gains.
Equity Value Metric
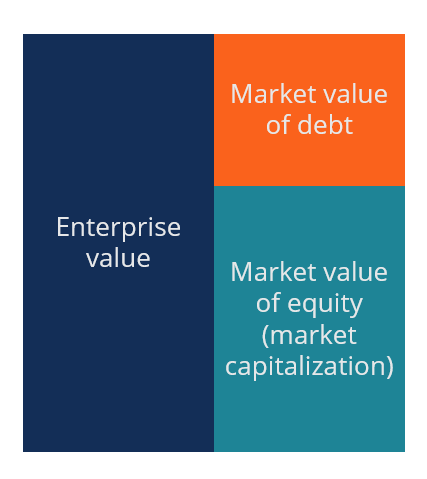
It’s important to know that a company’s market capitalization is the total value of its equity only. A company’s Enterprise ValueEnterprise Value (EV)Enterprise Value, or Firm Value, is the entire value of a firm equal to its equity value, plus net debt, plus any minority interest is the value of the entire business, including both equity and debt capital.
A simple example of the difference between equity value vs enterpriseEnterprise Value vs Equity ValueEnterprise value vs equity value. This guide explains the difference between the enterprise value (firm value) and the equity value of a business. See an example of how to calculate each and download the calculator. Enterprise value = equity value + debt - cash. Learn the meaning and how each is used in valuation value is with a house. If a house is worth $1,000,000 and has a $700,000 mortgage, the equity value is $300,000. The same applies to a business. A company with a Market Cap (equity value) of $10 billion and debt of $5 billion has an Enterprise Value of $15 billion.
Learn more about enterprise value vs equity valueEnterprise Value vs Equity ValueEnterprise value vs equity value. This guide explains the difference between the enterprise value (firm value) and the equity value of a business. See an example of how to calculate each and download the calculator. Enterprise value = equity value + debt - cash. Learn the meaning and how each is used in valuation.
Download the Free Template
Enter your name and email in the form below and download the free template now!
Additional Resources
Thank you for reading this guide to Market Capitalization! CFI’s mission is to help you advance your career. To keep learning and expanding your knowledge of corporate finance we highly recommend these additional CFI resources:
- Valuation MethodsValuation MethodsWhen valuing a company as a going concern there are three main valuation methods used: DCF analysis, comparable companies, and precedent transactions
- Comparable Company AnalysisComparable Company AnalysisThis guide shows you step-by-step how to build comparable company analysis ("Comps") and includes a free template and many examples.
- Stockholders EquityStockholders EquityStockholders Equity (also known as Shareholders Equity) is an account on a company's balance sheet that consists of share capital plus
- Market Cap to GDP Ratio (the Buffett Indicator)Market Cap to GDP Ratio (the Buffett Indicator)The Market Cap to GDP ratio (also known as the Buffett Indicator) is a measure of the total value of all publicly traded stock in a country, divided by that country’s Gross Domestic Product (GDP). It used as a broad way of assessing whether the country’s stock market is overvalued or undervalued, compared to an average
-

Fair Value vs. Market Value: Understanding the Difference
Let's say you need to get something valued — an asset, property, shares of stock or a company. The valuer typically will apply a measure called "fair value" or "fair market value&qu
-

Understanding Your IRA's Fair Market Value (FMV)
The fair market value, or FMV, of an IRA is the actual monetary value of the assets in an IRA. The term fair market value is typically used for a fair market value statement at the end of a cale
finance
- Understanding Market Capitalization: A Comprehensive Guide
- Understanding Financial Denomination: A Comprehensive Guide
- Understanding Market Capitalization: A Comprehensive Guide
- Understanding Market Value of Debt: Beyond Book Value
- Market Value vs. Investment Value: Understanding the Key Differences
- Value Traps: Identifying & Avoiding Investment Pitfalls
- Understanding Fair Market Value: A Comprehensive Guide
- Market Value vs. Book Value: Understanding the Difference
- Understanding Cryptocurrency Market Capitalization (Market Cap)
-
 Understanding Value Added: Definition & Business Applications
Value added is the extra value created over and above the original value of something. It can apply to products, services, companies, management, and other areas of business. In other word...
-
 What is Value Date?
Value date refers to the date when a transaction takes place or when the value of assets or money becomes effective. it is also used to determine the present value of a product with a fluctuating pric...