Hang Seng Index (HSI): A Comprehensive Guide to Hong Kong's Stock Market
The Hang Seng Index (HSI) is a stock market index in Hong Kong. It records and monitors the daily changes in stock prices of the 50 largest Hong Kong stock market companies. As the companies represent almost 60% of the Hong Kong Stock ExchangeHong Kong Stock ExchangeThe Hong Kong Stock Exchange (HKG) is a wholly-owned subsidiary of the Hong Kong Exchange and Clearing Limited (HKEx) and the leading, the Hang Seng Index is the main indicator of the Hong Kong market’s overall performance. Hang Seng Indexes Company Limited is currently responsible for compiling and maintaining the index.

History of the Hang Seng Index
The Hang Seng Index debuted in November 1969. It was conceived by Ho Sin Hang, the chairman of the Hang Seng Bank, who intended to create a Dow Jones Index for Hong Kong.
In 1985, four sub-indices were created to make the index clearer. Constituent stocks are now classified into four distinct sectors:
- Hang Seng Finance Sub-Index
- Hang Seng Utilities Sub-Index
- Hang Seng Properties Sub-Index
- Hang Seng Commerce & Industry Sub-Index
Hang Seng Index Constituent Stocks
The stocks that constitute the Hang Seng Index include major banks, utility companies, real estate companies, and entertainment companies. Notable constituent stocks include:
- HSBC Holdings plc
- Hang Seng Bank Ltd
- China Construction Bank
- China Life
- Hong Kong and China Gas Company Limited
- Country Garden
- China Resources Land Limited
- Swire Group
- Geely Auto
- China Mobile Ltd
- Mengniu Dairy
How are Hang Seng Index Constituent Stocks Selected?
For a stock to be considered for inclusion in the Hang Seng Index, it is subjected to extensive analysis with the help of external consultation. To be qualified for selection, companies must meet certain minimum requirements:
- Must be one of the companies that comprise the top 90% of total market value for all ordinary shares
- Must be one of the companies that comprise the top 90% of total turnover on the Stock Exchange of Hong Kong Limited
- Must have a listing history of at least 24 months or meet certain other requirements if they have been listed for less than 24 months
Once eligible candidates are identified, final selections take place. They are based on the eligible companies’:
- Market capitalizationMarket CapitalizationMarket Capitalization (Market Cap) is the most recent market value of a company’s outstanding shares. Market Cap is equal to the current share price multiplied by the number of shares outstanding. The investing community often uses the market capitalization value to rank companies and turnover rankings
- Financial performance
- Representation of the respective sub-sectors within the Hang Seng Index
How is the Hang Seng Index Calculated?
The Hang Seng Index is calculated based on a free-float-adjusted, market capitalization-weighted approach. The following formula is used:
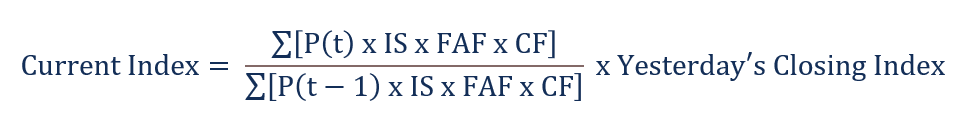
Where:
- P(t): Current price
- P(t-1): Closing price yesterday
- IS: Issued shares
- FAF: Free-float-adjusted factor, adjusted quarterly (between 0 and 1)
- CF: Cap factor, adjusted quarterly (between 0 and 1)
Statistics and Annual Returns
Although the Hang Seng Index was started in 1969, the index was calculated retroactively to 1965. Its base was set at 100 points, equal to the total value of the Hang Seng Index’s constituent stocks when the market closed on July 31, 1964.
On August 31, 1967, the Hang Seng Index reached its all-time low of 58.61. It first passed 10,000 points in December 1993, then passed 20,000 points in December 2006. In October 2007, it passed the 30,000-point milestone for the first time. The Hang Seng Index’s all-time high was set on January 26, 2018, at 33,223.58 points. As of December 2020, the Index sits at around 26,500 points.
Since 1965, the average percentage change in the Hang Seng Index is approximately 19.2% per year. The highest annual return occurred in 1972 when the index rose 147.07%. The lowest annual return occurred in 1974 when it contracted by -60.54%.
In the 2010s, the Hang Seng Index grew by an average of approximately 3.7% per year. The highest returns of the decade were seen in 2017 when the index grew by 35.99%. The lowest returns of the decade occurred in 2011 when it fell by -19.97%.
Additional Information
To monitor daily reports for the Hang Seng Index, investors may use the following reports:
- Hang Seng Index’s Daily Bulletin
- Hang Seng Index (HSI) Constituent Stocks Performance
- Index Performance Summary
- Total Returns Index Series Daily Bulletin
Related Readings
CFI is the official provider of the global Capital Markets & Securities Analyst (CMSA)®Program Page - CMSAEnroll in CFI's CMSA® program and become a certified Capital Markets &Securities Analyst. Advance your career with our certification programs and courses. certification program, designed to help anyone become a world-class financial analyst. To keep advancing your career, the additional resources below will be useful:
- Dow Jones Industrial Average (DJIA)Dow Jones Industrial Average (DJIA)The Dow Jones Industrial Average (DJIA), also referred to as "Dow Jones” or "the Dow", is one of the most widely-recognized stock market indices.
- Hong Kong Monetary AuthorityHong Kong Monetary Authority (HKMA)The Hong Kong Monetary Authority is a government entity that was founded on April 1, 1993 as the de facto central bank and Hong Kong's
- Share ClassShare Classshare classes are usually created from various types of shares in a company. The type of shares and share classes that a company can create
- Stock Market IndexStock Market IndexA stock market index, also known as a stock index, measures a section of the stock market. In other words, the index measures the change in
-
NIFTY 50 Index: Understanding India's Top 50 Stocks | NSE
NIFTY 50 is the most important index of the National Stock Exchange of India Limited (NSE)National Stock Exchange of India Limited (NSE)The National Stock Exchange of India Limited (NSE) is the larges
-
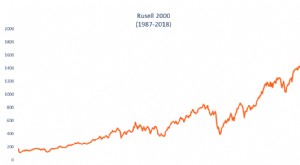
Russell 2000 Index: Definition, Performance & Investing
The Russell 2000 is a stock market index that tracks the performance of 2,000 US small-cap stocksSmall Cap StockA small cap stock is a stock of a publicly traded company whose market capitalization ra
invest
- Advance-Decline Line: Understanding Market Sentiment & Trends
- Arms Index (TRIN): Understanding Short-Term Market Sentiment
- DAX Index: Your Guide to Germany's Top 30 Companies
- EAFE Index: Understanding Developed Market Performance
- KBW Bank Index: Tracking US Banking Sector Performance
- NASDAQ-100 Index: Definition, Components & Historical Data
- Nikkei Index: Understanding Japan's Top Stock Market Indicator
- Price-Weighted Index Explained: How It Works & Examples
- Understanding the S&P 500: Top Holdings & Long-Term Performance
-
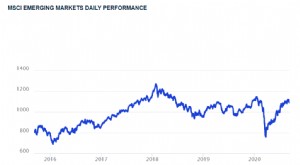 MSCI Emerging Markets Index: Definition & Key Facts
The MSCI Emerging Markets Index is used to measure the stock market performance within emerging countries. Established in the 1960s, It is one of many indexes created by Morgan Stanley Capital Interna...
-
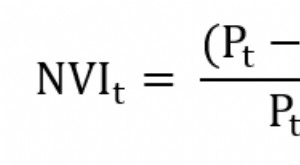 Negative Volume Index (NVI): A Comprehensive Guide
The Negative Volume Index (NVI) is a technical indicator used to identify trends in a market. It is a cumulative indicator, which means that all changes to the indicator accumulate. Put another way, t...